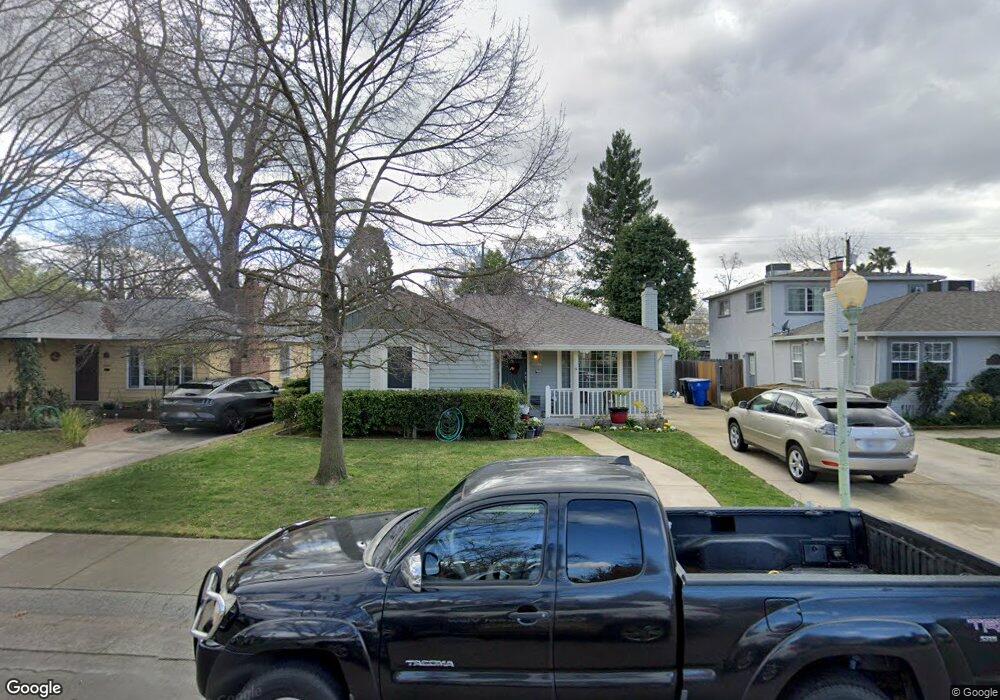
4900 Reid Way Sacramento, CA 95819
East Sacramento NeighborhoodEstimated Value: $457,000 - $663,000
3
Beds
1
Bath
1,050
Sq Ft
$568/Sq Ft
Est. Value
About This Home
This home is located at 4900 Reid Way, Sacramento, CA 95819 and is currently estimated at $596,107, approximately $567 per square foot. 4900 Reid Way is a home located in Sacramento County with nearby schools including Theodore Judah Elementary, Miwok Middle School, and Hiram W. Johnson High School.
Ownership History
Date
Name
Owned For
Owner Type
Purchase Details
Closed on
Mar 16, 2016
Sold by
Kreisher Denzil G and Cervantes Kreisher Olivia
Bought by
Kre Denzil G Kreisher and Kre Olivia Cervantes
Current Estimated Value
Home Financials for this Owner
Home Financials are based on the most recent Mortgage that was taken out on this home.
Original Mortgage
$311,000
Outstanding Balance
$246,155
Interest Rate
3.65%
Mortgage Type
New Conventional
Estimated Equity
$349,952
Purchase Details
Closed on
Jun 23, 2006
Sold by
Kreisher Denzil G and Cervantes Kreisher Olivia
Bought by
Kreisher Denzil G and Cervantes Kreisher Olivia
Purchase Details
Closed on
Mar 20, 2003
Sold by
Dinsmore Marlies and Alexander Renate
Bought by
Kreisher Denzil G and Cervantes Kreisher Olivia
Home Financials for this Owner
Home Financials are based on the most recent Mortgage that was taken out on this home.
Original Mortgage
$210,000
Interest Rate
5.79%
Create a Home Valuation Report for This Property
The Home Valuation Report is an in-depth analysis detailing your home's value as well as a comparison with similar homes in the area
Home Values in the Area
Average Home Value in this Area
Purchase History
| Date | Buyer | Sale Price | Title Company |
|---|---|---|---|
| Kre Denzil G Kreisher | -- | Stewart Sac | |
| Kreisher Denzil G | -- | None Available | |
| Kreisher Denzil G | $280,500 | Financial Title Company |
Source: Public Records
Mortgage History
| Date | Status | Borrower | Loan Amount |
|---|---|---|---|
| Open | Kre Denzil G Kreisher | $311,000 | |
| Closed | Kreisher Denzil G | $210,000 |
Source: Public Records
Tax History Compared to Growth
Tax History
| Year | Tax Paid | Tax Assessment Tax Assessment Total Assessment is a certain percentage of the fair market value that is determined by local assessors to be the total taxable value of land and additions on the property. | Land | Improvement |
|---|---|---|---|---|
| 2025 | $4,771 | $406,086 | $181,029 | $225,057 |
| 2024 | $4,771 | $398,125 | $177,480 | $220,645 |
| 2023 | $4,657 | $390,319 | $174,000 | $216,319 |
| 2022 | $4,578 | $382,667 | $170,589 | $212,078 |
| 2021 | $4,361 | $375,165 | $167,245 | $207,920 |
| 2020 | $4,396 | $371,320 | $165,531 | $205,789 |
| 2019 | $4,302 | $364,040 | $162,286 | $201,754 |
| 2018 | $4,189 | $356,903 | $159,104 | $197,799 |
| 2017 | $4,130 | $349,906 | $155,985 | $193,921 |
| 2016 | $4,040 | $343,046 | $152,927 | $190,119 |
| 2015 | $3,980 | $337,894 | $150,630 | $187,264 |
| 2014 | $3,872 | $331,276 | $147,680 | $183,596 |
Source: Public Records
Map
Nearby Homes