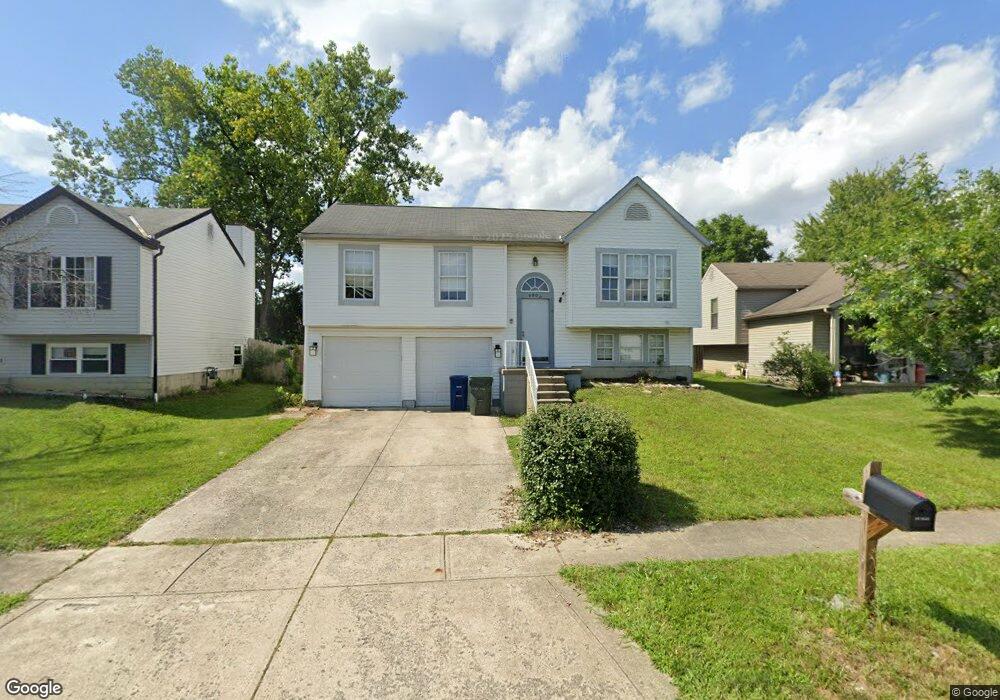
4900 River Trail Ct Columbus, OH 43228
Cherry Creek NeighborhoodEstimated Value: $247,000 - $266,000
3
Beds
2
Baths
1,384
Sq Ft
$185/Sq Ft
Est. Value
About This Home
This home is located at 4900 River Trail Ct, Columbus, OH 43228 and is currently estimated at $256,651, approximately $185 per square foot. 4900 River Trail Ct is a home located in Franklin County with nearby schools including Stiles Elementary School, Holt Crossing Intermediate School, and Pleasant View Middle School.
Ownership History
Date
Name
Owned For
Owner Type
Purchase Details
Closed on
Jul 19, 2021
Sold by
Flinn Errol F and Deutsche Bank National Trust C
Bought by
Mackisha Homes Llc
Current Estimated Value
Purchase Details
Closed on
Jul 18, 2006
Sold by
Wells Fargo Bank Na
Bought by
Flinn Errol F
Home Financials for this Owner
Home Financials are based on the most recent Mortgage that was taken out on this home.
Original Mortgage
$112,000
Interest Rate
6.82%
Mortgage Type
Balloon
Purchase Details
Closed on
May 4, 2006
Sold by
Warnick Margaret S and Case #05Cve09 9900
Bought by
Wells Fargo Bank Na
Purchase Details
Closed on
Sep 11, 1995
Sold by
Fritsche Corp
Bought by
Warnick Gary L and Warnick Margaret S
Home Financials for this Owner
Home Financials are based on the most recent Mortgage that was taken out on this home.
Original Mortgage
$100,248
Interest Rate
7.76%
Mortgage Type
FHA
Create a Home Valuation Report for This Property
The Home Valuation Report is an in-depth analysis detailing your home's value as well as a comparison with similar homes in the area
Home Values in the Area
Average Home Value in this Area
Purchase History
| Date | Buyer | Sale Price | Title Company |
|---|---|---|---|
| Mackisha Homes Llc | $151,000 | None Available | |
| Flinn Errol F | $112,000 | Title First | |
| Wells Fargo Bank Na | $90,000 | None Available | |
| Warnick Gary L | $101,390 | -- |
Source: Public Records
Mortgage History
| Date | Status | Borrower | Loan Amount |
|---|---|---|---|
| Previous Owner | Flinn Errol F | $112,000 | |
| Previous Owner | Warnick Gary L | $100,248 |
Source: Public Records
Tax History
| Year | Tax Paid | Tax Assessment Tax Assessment Total Assessment is a certain percentage of the fair market value that is determined by local assessors to be the total taxable value of land and additions on the property. | Land | Improvement |
|---|---|---|---|---|
| 2025 | $3,055 | $77,670 | $22,930 | $54,740 |
| 2024 | $3,055 | $77,670 | $22,930 | $54,740 |
| 2023 | $4,628 | $77,665 | $22,925 | $54,740 |
| 2022 | $3,644 | $44,700 | $9,240 | $35,460 |
| 2021 | $2,757 | $44,700 | $9,240 | $35,460 |
| 2020 | $2,966 | $44,700 | $9,240 | $35,460 |
| 2019 | $2,080 | $37,070 | $7,700 | $29,370 |
| 2018 | $2,099 | $37,070 | $7,700 | $29,370 |
| 2017 | $2,060 | $37,070 | $7,700 | $29,370 |
| 2016 | $2,128 | $35,180 | $5,810 | $29,370 |
| 2015 | $2,128 | $35,180 | $5,810 | $29,370 |
| 2014 | $2,131 | $35,180 | $5,810 | $29,370 |
| 2013 | $1,109 | $37,030 | $6,125 | $30,905 |
Source: Public Records
Map
Nearby Homes
- 4848 Deephollow Dr
- 470 Woodlawn Ave
- 495 Daytona Rd
- 400 Evergreen Terrace
- 531 Emmit Ave
- 546 Emmit Ave
- 354 Fernhill Ave
- 429 Postle Blvd
- 377 S Murray Hill Rd
- 257 S Murray Hill Rd
- 299 Lombard Rd
- 557 Simbury St
- 496 Clairbrook Ave Unit Jc-13
- 443 Clairbrook Ave
- 4682 Arnold Ave
- 104 Oxley Rd
- 621 Simbury St Unit D6
- 671 Simbury St
- 634 Dlyn St Unit 5
- 4647 Henley Ave
- 4906 River Trail Ct
- 4892 River Trail Ct
- 655 Cherry Glen Rd
- 649 Cherry Glen Rd
- 649 Cherry Glen Rd Unit A
- 653 Cherry Glen Rd
- 4912 River Trail Ct
- 651 Cherry Glen Dr
- 4886 River Trail Ct
- 651 Cherry Glen Rd
- 651 Cherry Glen Rd Unit C
- 645 Cherry Glen Rd Unit 22C
- 645 Cherry Glen Rd Unit C
- 647 Cherry Glen Rd Unit 22A
- 647 Cherry Glen Rd Unit A
- 638 Cherry Glen Rd
- 638 Cherry Glen Rd Unit A
- 4918 River Trail Ct
- 644 Cherry Glen Rd
- 646 Pine Trace Ct
Your Personal Tour Guide
Ask me questions while you tour the home.