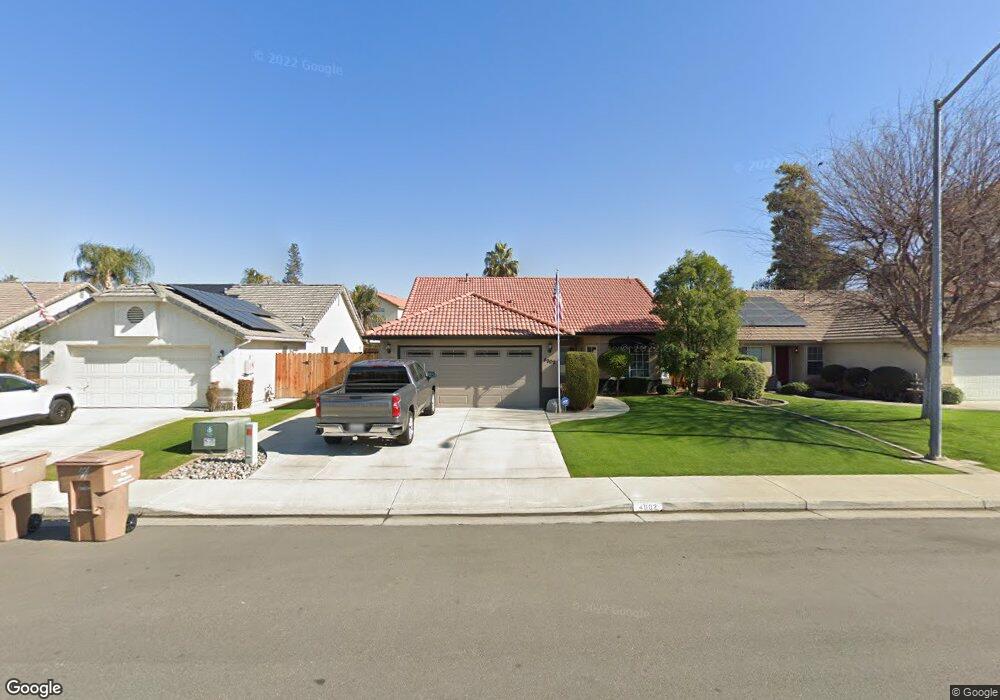
4902 Marsh Hawk Dr Bakersfield, CA 93312
Riverlakes NeighborhoodEstimated Value: $354,978 - $393,000
3
Beds
2
Baths
1,366
Sq Ft
$276/Sq Ft
Est. Value
About This Home
This home is located at 4902 Marsh Hawk Dr, Bakersfield, CA 93312 and is currently estimated at $376,745, approximately $275 per square foot. 4902 Marsh Hawk Dr is a home located in Kern County with nearby schools including Discovery Elementary School, Centennial High School, and Olive Knolls Christian.
Ownership History
Date
Name
Owned For
Owner Type
Purchase Details
Closed on
Aug 24, 2017
Sold by
Conner Larry W and Conner Linda L
Bought by
Conner Linda L and Conner Larry W
Current Estimated Value
Home Financials for this Owner
Home Financials are based on the most recent Mortgage that was taken out on this home.
Original Mortgage
$170,000
Outstanding Balance
$141,852
Interest Rate
3.96%
Mortgage Type
New Conventional
Estimated Equity
$234,893
Purchase Details
Closed on
Sep 21, 1998
Sold by
Us Home Corp
Bought by
Conner Larry W and Conner Linda L
Home Financials for this Owner
Home Financials are based on the most recent Mortgage that was taken out on this home.
Original Mortgage
$101,636
Interest Rate
6.88%
Mortgage Type
FHA
Create a Home Valuation Report for This Property
The Home Valuation Report is an in-depth analysis detailing your home's value as well as a comparison with similar homes in the area
Home Values in the Area
Average Home Value in this Area
Purchase History
| Date | Buyer | Sale Price | Title Company |
|---|---|---|---|
| Conner Linda L | -- | Chicago Title Company | |
| Conner Larry W | $121,500 | Stewart Title |
Source: Public Records
Mortgage History
| Date | Status | Borrower | Loan Amount |
|---|---|---|---|
| Open | Conner Linda L | $170,000 | |
| Previous Owner | Conner Larry W | $101,636 |
Source: Public Records
Tax History
| Year | Tax Paid | Tax Assessment Tax Assessment Total Assessment is a certain percentage of the fair market value that is determined by local assessors to be the total taxable value of land and additions on the property. | Land | Improvement |
|---|---|---|---|---|
| 2025 | $2,595 | $159,883 | $39,180 | $120,703 |
| 2024 | $2,545 | $156,749 | $38,412 | $118,337 |
| 2023 | $2,545 | $153,676 | $37,659 | $116,017 |
| 2022 | $2,495 | $150,664 | $36,921 | $113,743 |
| 2021 | $2,389 | $147,711 | $36,198 | $111,513 |
| 2020 | $2,379 | $146,197 | $35,827 | $110,370 |
| 2019 | $2,263 | $146,197 | $35,827 | $110,370 |
| 2018 | $2,280 | $140,522 | $34,437 | $106,085 |
| 2017 | $2,229 | $137,767 | $33,762 | $104,005 |
| 2016 | $2,094 | $135,066 | $33,100 | $101,966 |
| 2015 | $2,073 | $133,038 | $32,603 | $100,435 |
| 2014 | $2,029 | $130,433 | $31,965 | $98,468 |
Source: Public Records
Map
Nearby Homes
- 8613 Beaver Dr
- 8609 Goldfinch Dr
- 8502 Sun Harbor Dr
- 4615 Islands Dr
- 8707 Shore View Dr
- 8118 Whitewater Dr
- 4702 Aviara Dr
- 8105 Pebble Cove Ct
- 4713 Cresta Verde Place
- 5507 Brigadoon Ln
- 8214 Maple Grove Ln
- 5110 Boulder Creek Place
- 5011 Pelican Hill Dr
- 5204 Boulder Creek Place
- 8510 Mainsail Dr
- 7809 Carol Sue Ct
- 7717 Angoras Ct
- 7815 Vaquero Ave
- 8105 Mossrock Dr
- 8918 Red River Ct
- 4820 Marsh Hawk Dr
- 4906 Marsh Hawk Dr
- 4923 Sanderling Ln
- 4910 Marsh Hawk Dr
- 4816 Marsh Hawk Dr
- 4919 Sanderling Ln
- 4915 Sanderling Ln
- 4927 Sanderling Ln
- 4903 Marsh Hawk Dr
- 4812 Marsh Hawk Dr
- 4914 Marsh Hawk Dr
- 4907 Marsh Hawk Dr
- 4821 Marsh Hawk Dr
- 4911 Marsh Hawk Dr
- 4911 Sanderling Ln
- 4817 Marsh Hawk Dr
- 4915 Marsh Hawk Dr
- 8612 Cattail Ln
- 4808 Marsh Hawk Dr
- 4907 Sanderling Ln
Your Personal Tour Guide
Ask me questions while you tour the home.