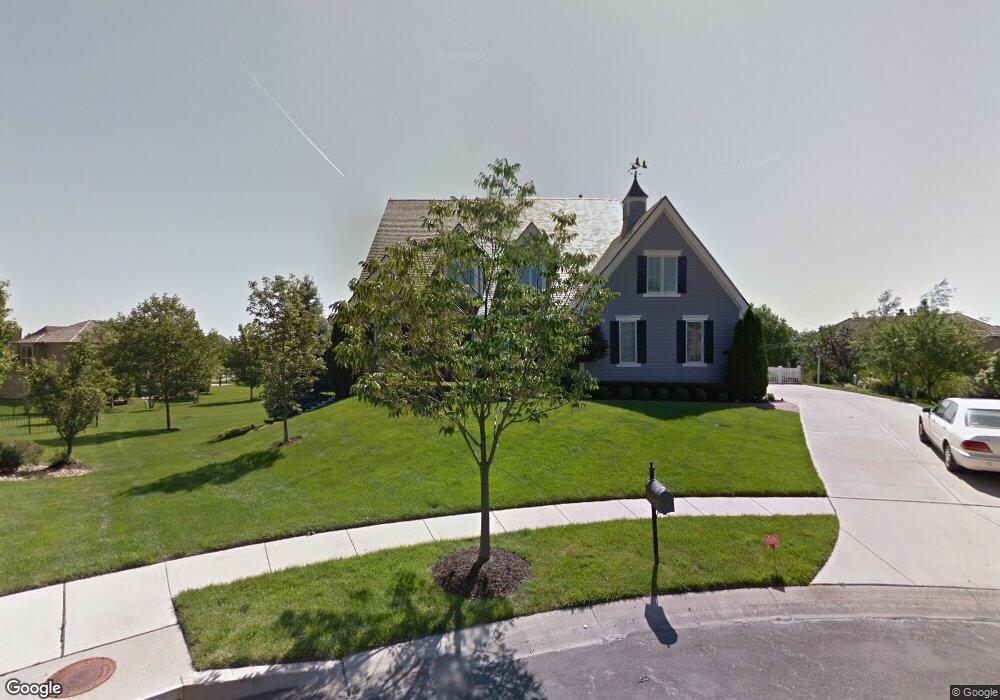
4902 W 144th St Overland Park, KS 66224
Estimated Value: $1,381,000 - $1,587,000
5
Beds
6
Baths
6,147
Sq Ft
$243/Sq Ft
Est. Value
About This Home
This home is located at 4902 W 144th St, Overland Park, KS 66224 and is currently estimated at $1,493,080, approximately $242 per square foot. 4902 W 144th St is a home located in Johnson County with nearby schools including Overland Trail Elementary School, Overland Trail Middle School, and Blue Valley North High School.
Ownership History
Date
Name
Owned For
Owner Type
Purchase Details
Closed on
Apr 6, 2010
Sold by
Shea Robert S and Shea Donna Frazier
Bought by
Shea Robert S and Shea Donna Frazier
Current Estimated Value
Purchase Details
Closed on
Aug 28, 2002
Sold by
Koehler Building Co Inc
Bought by
Shea Robert and Shea Donna
Home Financials for this Owner
Home Financials are based on the most recent Mortgage that was taken out on this home.
Original Mortgage
$873,060
Outstanding Balance
$188,952
Interest Rate
6.47%
Mortgage Type
Construction
Estimated Equity
$1,304,128
Purchase Details
Closed on
Aug 15, 2002
Sold by
Highlands Group
Bought by
Koehler Building Co Inc
Home Financials for this Owner
Home Financials are based on the most recent Mortgage that was taken out on this home.
Original Mortgage
$873,060
Outstanding Balance
$188,952
Interest Rate
6.47%
Mortgage Type
Construction
Estimated Equity
$1,304,128
Create a Home Valuation Report for This Property
The Home Valuation Report is an in-depth analysis detailing your home's value as well as a comparison with similar homes in the area
Home Values in the Area
Average Home Value in this Area
Purchase History
| Date | Buyer | Sale Price | Title Company |
|---|---|---|---|
| Shea Robert S | -- | None Available | |
| Shea Donna Frazier | -- | None Available | |
| Shea Robert | -- | Security Land Title Company | |
| Koehler Building Co Inc | -- | Security Land Title Company |
Source: Public Records
Mortgage History
| Date | Status | Borrower | Loan Amount |
|---|---|---|---|
| Open | Shea Robert | $873,060 |
Source: Public Records
Tax History Compared to Growth
Tax History
| Year | Tax Paid | Tax Assessment Tax Assessment Total Assessment is a certain percentage of the fair market value that is determined by local assessors to be the total taxable value of land and additions on the property. | Land | Improvement |
|---|---|---|---|---|
| 2024 | $17,945 | $159,321 | $47,969 | $111,352 |
| 2023 | $16,782 | $147,787 | $47,969 | $99,818 |
| 2022 | $16,176 | $139,449 | $47,969 | $91,480 |
| 2021 | $15,430 | $127,443 | $43,622 | $83,821 |
| 2020 | $15,262 | $123,510 | $43,622 | $79,888 |
| 2019 | $14,815 | $117,760 | $43,622 | $74,138 |
| 2018 | $15,587 | $121,659 | $43,622 | $78,037 |
| 2017 | $15,811 | $121,337 | $43,622 | $77,715 |
| 2016 | $14,598 | $112,171 | $39,660 | $72,511 |
| 2015 | $14,462 | $109,779 | $39,661 | $70,118 |
| 2013 | -- | $105,800 | $36,103 | $69,697 |
Source: Public Records
Map
Nearby Homes
- 5501 W 146th St
- 14013 Juniper St
- 5701 W 146th St
- 14708 Cedar St
- 14004 Linden St
- 14713 Ash St
- 13606 Granada St
- 13608 Granada St
- 5304 W 148th St
- 14724 Maple St
- 14712 Maple St
- 14005 Nicklaus Dr
- 4520 W 140th St
- 14420 Mission Rd
- 4512 W 139th St
- 5704 W 148th Terrace
- 3905 W 142nd Dr
- 0 Mission Rd Unit HMS2528409
- 5108 W 150th St
- 14008 Outlook St
- 4906 W 144th St
- 4901 W 144th St
- 4824 W 144th Terrace
- 4817 W 143rd Terrace
- 4813 W 143rd Terrace
- 4820 W 144th Terrace
- 4821 W 143rd Terrace
- 4902 W 144th Terrace
- 4905 W 144th St
- 4910 W 144th St
- 4814 W 144th Terrace
- 4901 W 143rd Terrace
- 4904 W 144th Terrace
- 14405 Briar St
- 4809 W 143rd Terrace
- 4825 W 144th Terrace
- 4824 W 143rd Terrace
- 4820 W 143rd Terrace
- 4810 W 144th Terrace
- 4821 W 144th Terrace