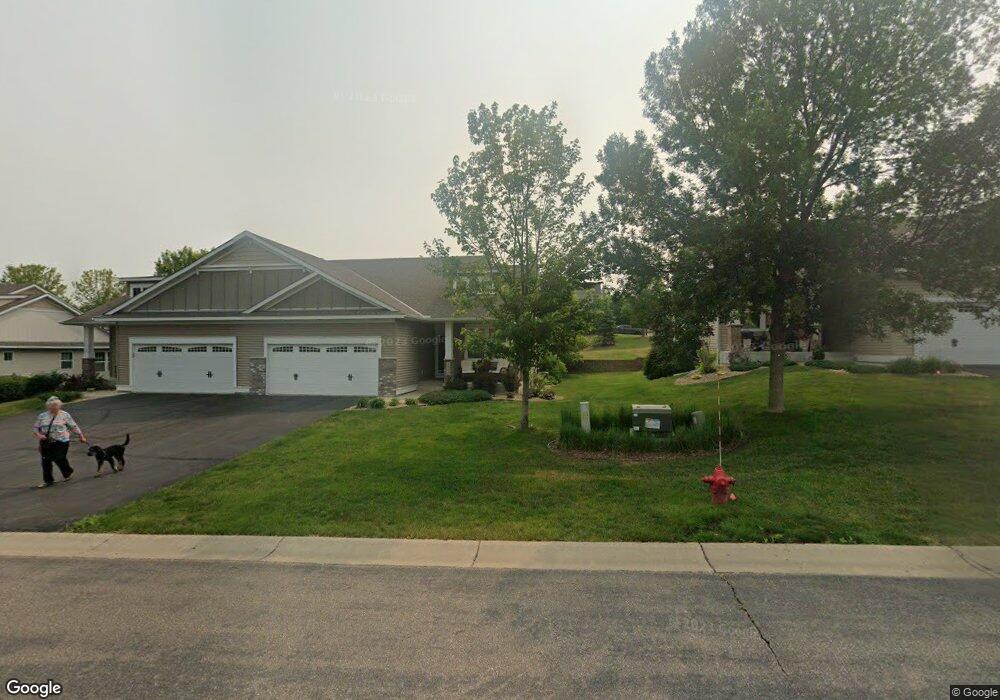
4904 Twins Ct Saint Paul, MN 55123
Estimated Value: $382,000 - $449,000
1
Bed
2
Baths
1,288
Sq Ft
$321/Sq Ft
Est. Value
About This Home
This home is located at 4904 Twins Ct, Saint Paul, MN 55123 and is currently estimated at $412,911, approximately $320 per square foot. 4904 Twins Ct is a home located in Dakota County with nearby schools including Red Pine Elementary School, Dakota Hills Middle School, and Eagan Senior High School.
Ownership History
Date
Name
Owned For
Owner Type
Purchase Details
Closed on
Apr 12, 2022
Sold by
Judith A Horgen Trustee Of The Judith
Bought by
Robinson Debra
Current Estimated Value
Home Financials for this Owner
Home Financials are based on the most recent Mortgage that was taken out on this home.
Original Mortgage
$300,000
Outstanding Balance
$280,705
Interest Rate
3.89%
Mortgage Type
New Conventional
Estimated Equity
$132,206
Purchase Details
Closed on
May 28, 2015
Sold by
Horgen Judith A
Bought by
Horgen Judith A and The Judith A Horgen Revocable Living Tru
Purchase Details
Closed on
Jul 25, 2012
Sold by
Brandl/Anderson Homes Inc
Bought by
Horgen Judith A
Home Financials for this Owner
Home Financials are based on the most recent Mortgage that was taken out on this home.
Original Mortgage
$200,740
Interest Rate
2.62%
Mortgage Type
Adjustable Rate Mortgage/ARM
Purchase Details
Closed on
Sep 27, 2005
Sold by
Manley Land Development Inc
Bought by
Brandl Anderson Homes Inc
Create a Home Valuation Report for This Property
The Home Valuation Report is an in-depth analysis detailing your home's value as well as a comparison with similar homes in the area
Home Values in the Area
Average Home Value in this Area
Purchase History
| Date | Buyer | Sale Price | Title Company |
|---|---|---|---|
| Robinson Debra | $389,000 | -- | |
| Horgen Judith A | -- | None Available | |
| Horgen Judith A | $250,927 | Land Title | |
| Brandl Anderson Homes Inc | $1,800,000 | -- |
Source: Public Records
Mortgage History
| Date | Status | Borrower | Loan Amount |
|---|---|---|---|
| Open | Robinson Debra | $300,000 | |
| Previous Owner | Horgen Judith A | $200,740 |
Source: Public Records
Tax History Compared to Growth
Tax History
| Year | Tax Paid | Tax Assessment Tax Assessment Total Assessment is a certain percentage of the fair market value that is determined by local assessors to be the total taxable value of land and additions on the property. | Land | Improvement |
|---|---|---|---|---|
| 2024 | $4,070 | $380,000 | $129,600 | $250,400 |
| 2023 | $4,070 | $377,200 | $128,700 | $248,500 |
| 2022 | $3,598 | $376,100 | $128,300 | $247,800 |
| 2021 | $3,524 | $325,700 | $111,600 | $214,100 |
| 2020 | $3,574 | $312,400 | $106,300 | $206,100 |
| 2019 | $3,223 | $308,400 | $101,200 | $207,200 |
| 2018 | $3,055 | $294,700 | $93,700 | $201,000 |
| 2017 | $3,051 | $272,400 | $85,200 | $187,200 |
| 2016 | $2,905 | $260,600 | $81,100 | $179,500 |
| 2015 | $3,493 | $232,535 | $73,284 | $159,251 |
| 2014 | -- | $286,163 | $70,600 | $215,563 |
| 2013 | -- | $230,246 | $61,643 | $168,603 |
Source: Public Records
Map
Nearby Homes
- 4902 Brooklyn Ln
- 637 Remington Ct
- 625 Remington Ct
- 635 Parkside Ct
- 11735 Azure Cir
- 636 Parkside Ct
- 4837 Avery Ct
- 11732 Azure Cir
- 4928 Parkside Cir
- 4955 Parkside Cir
- 4927 Parkside Cir
- 4938 Parkside Cir
- 11700 Azure Ln
- 4829 Redpoll Ct
- 11798 Azure Ln
- 4944 Parkside Cir
- 11784 Azure Ln
- 4950 Parkside Cir
- 4951 Parkside Cir
- 4982 Dodd Rd