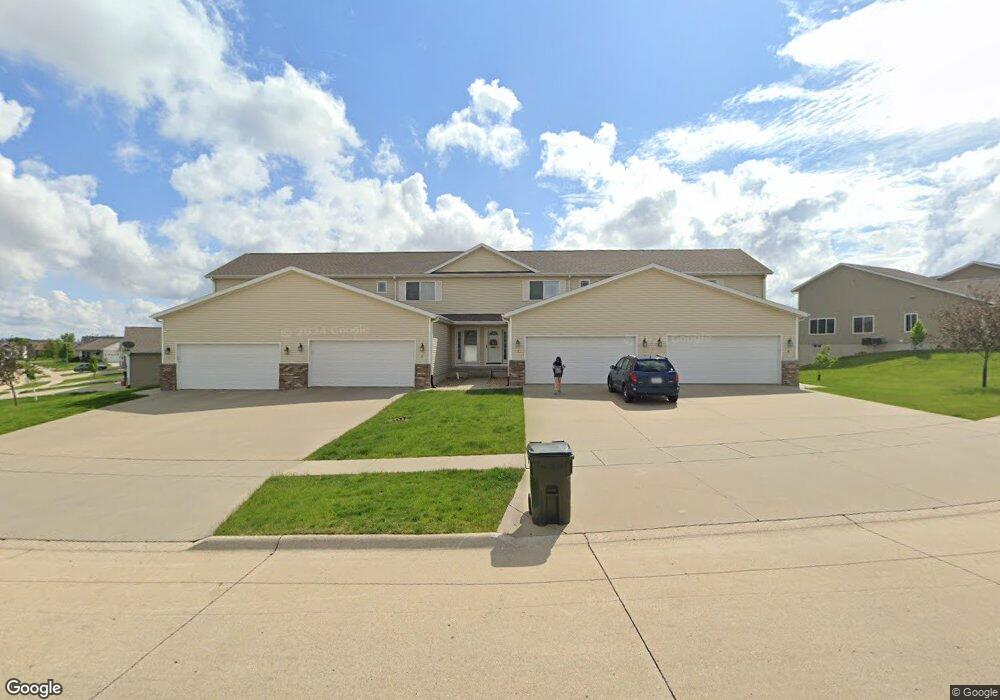
4905 Algonquin Dr Unit 2 Cedar Falls, IA 50613
Estimated Value: $237,000 - $252,000
3
Beds
3
Baths
1,923
Sq Ft
$126/Sq Ft
Est. Value
About This Home
This home is located at 4905 Algonquin Dr Unit 2, Cedar Falls, IA 50613 and is currently estimated at $242,514, approximately $126 per square foot. 4905 Algonquin Dr Unit 2 is a home located in Black Hawk County with nearby schools including Southdale Elementary School, Peet Junior High School, and Cedar Falls High School.
Ownership History
Date
Name
Owned For
Owner Type
Purchase Details
Closed on
May 15, 2012
Sold by
Brenden Timothy J and Brenden Erica M
Bought by
Vandorn Michelle A
Current Estimated Value
Home Financials for this Owner
Home Financials are based on the most recent Mortgage that was taken out on this home.
Original Mortgage
$125,600
Outstanding Balance
$86,794
Interest Rate
3.92%
Mortgage Type
New Conventional
Estimated Equity
$155,720
Purchase Details
Closed on
Aug 30, 2010
Sold by
Co Robson Homes Inc
Bought by
Brenden Timothy J and Brenden Erica M
Home Financials for this Owner
Home Financials are based on the most recent Mortgage that was taken out on this home.
Original Mortgage
$119,920
Interest Rate
4.5%
Mortgage Type
Adjustable Rate Mortgage/ARM
Create a Home Valuation Report for This Property
The Home Valuation Report is an in-depth analysis detailing your home's value as well as a comparison with similar homes in the area
Home Values in the Area
Average Home Value in this Area
Purchase History
| Date | Buyer | Sale Price | Title Company |
|---|---|---|---|
| Vandorn Michelle A | $157,000 | None Available | |
| Brenden Timothy J | $150,000 | None Available |
Source: Public Records
Mortgage History
| Date | Status | Borrower | Loan Amount |
|---|---|---|---|
| Open | Vandorn Michelle A | $125,600 | |
| Previous Owner | Brenden Timothy J | $119,920 |
Source: Public Records
Tax History Compared to Growth
Tax History
| Year | Tax Paid | Tax Assessment Tax Assessment Total Assessment is a certain percentage of the fair market value that is determined by local assessors to be the total taxable value of land and additions on the property. | Land | Improvement |
|---|---|---|---|---|
| 2025 | $3,050 | $219,340 | $19,310 | $200,030 |
| 2024 | $3,050 | $199,810 | $19,310 | $180,500 |
| 2023 | $3,308 | $199,810 | $19,310 | $180,500 |
| 2022 | $3,346 | $188,070 | $14,850 | $173,220 |
| 2021 | $3,078 | $188,070 | $14,850 | $173,220 |
| 2020 | $3,012 | $173,870 | $14,850 | $159,020 |
| 2019 | $3,012 | $173,870 | $14,850 | $159,020 |
| 2018 | $3,052 | $173,870 | $14,850 | $159,020 |
| 2017 | $3,052 | $173,870 | $14,850 | $159,020 |
| 2016 | $2,814 | $167,910 | $11,730 | $156,180 |
| 2015 | $2,814 | $167,910 | $11,730 | $156,180 |
| 2014 | $2,592 | $153,720 | $11,730 | $141,990 |
Source: Public Records
Map
Nearby Homes
- 4902 Algonquin Dr Unit 1
- 4805 Algonquin Dr Unit 3
- 1125 Amelia Dr Unit 4
- 4651 Loren Dr
- 4652 Loren Dr
- 4607 Loren Dr
- 1117 Loren Dr
- 5405 Celtic Ct
- 0 Greenhill Crossing Outlots Y & B
- 4320 Spruce Creek Dr Unit 405
- 4614 Donald Dr
- 5420 Fjord Dr
- 5313 Norse Dr
- 430 Balboa Ave
- 407 Balboa Ave
- Lot 15 Ashworth Dr
- Lot 9 Ashworth Dr
- Lot 14 Ashworth Dr
- Lot 19 Ashworth Dr
- Lot 22 Ashworth Dr
- 4905 Algonquin Dr Unit 4
- 4905 Algonquin Dr Unit 3
- 4925 Algonquin Dr Unit 4
- 4925 Algonquin Dr Unit 3
- 4925 Algonquin Dr Unit 2
- 4825 Algonquin Dr
- 4825 Algonquin Dr Unit 4
- 4825 Algonquin Dr Unit 3
- 4825 Algonquin Dr Unit 1
- 4910 Algonquin Dr Unit 1
- 4910 Algonquin Dr Unit 5
- 4910 Algonquin Dr Unit 3
- 4910 Algonquin Dr Unit 4
- 4910 Algonquin Dr Unit 6
- 4910 Algonquin Dr Unit 2
- 4902 Algonquin Dr Unit 3
- 4902 Algonquin Dr Unit 2
- 4902 Algonquin Dr
- 4902 Algonquin Dr Unit 4
- 4902 Algonquin Dr Unit 5