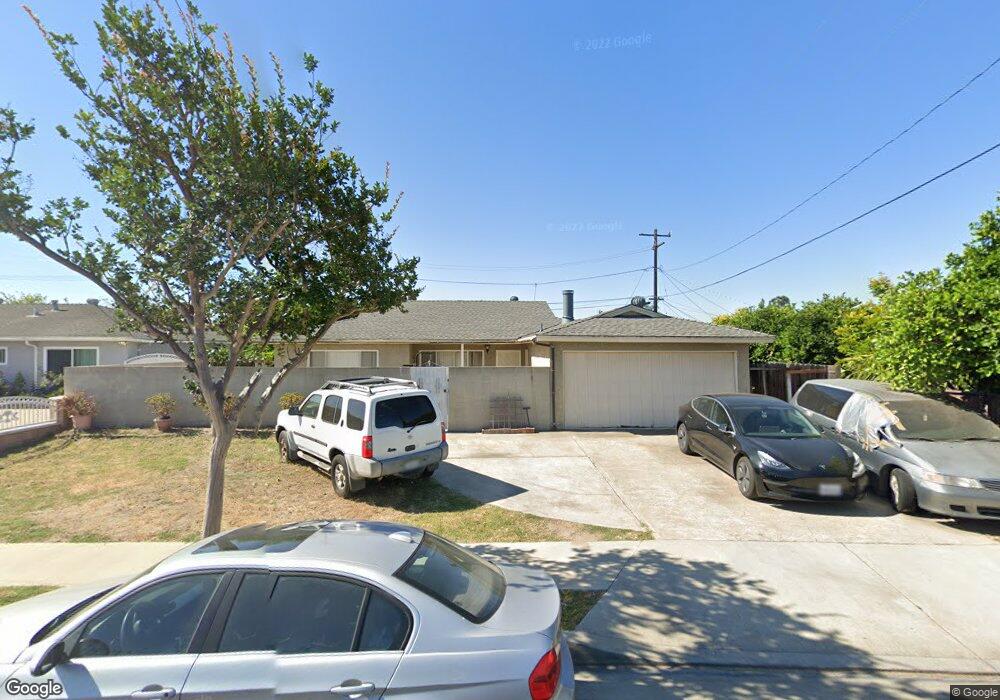
4906 Bruce Ave Santa Ana, CA 92703
Riverview West NeighborhoodEstimated Value: $896,000 - $1,029,000
4
Beds
2
Baths
1,310
Sq Ft
$724/Sq Ft
Est. Value
About This Home
This home is located at 4906 Bruce Ave, Santa Ana, CA 92703 and is currently estimated at $948,271, approximately $723 per square foot. 4906 Bruce Ave is a home located in Orange County with nearby schools including Rosita Elementary School, James Irvine Intermediate School, and Bolsa Grande High School.
Ownership History
Date
Name
Owned For
Owner Type
Purchase Details
Closed on
Dec 14, 2000
Sold by
Ardon Jose Miguel and Ardon Jose Miguel
Bought by
Do Thu Hong
Current Estimated Value
Home Financials for this Owner
Home Financials are based on the most recent Mortgage that was taken out on this home.
Original Mortgage
$114,900
Interest Rate
7.41%
Purchase Details
Closed on
Oct 8, 1997
Sold by
Ardon Zoila O
Bought by
Ardon Jose Miguel
Home Financials for this Owner
Home Financials are based on the most recent Mortgage that was taken out on this home.
Original Mortgage
$152,782
Interest Rate
7.54%
Mortgage Type
FHA
Purchase Details
Closed on
Sep 9, 1997
Sold by
Grina John P and Grina Laurie J
Bought by
Ardon Jose Miguel and Ardon Jose Miguel
Home Financials for this Owner
Home Financials are based on the most recent Mortgage that was taken out on this home.
Original Mortgage
$152,782
Interest Rate
7.54%
Mortgage Type
FHA
Create a Home Valuation Report for This Property
The Home Valuation Report is an in-depth analysis detailing your home's value as well as a comparison with similar homes in the area
Home Values in the Area
Average Home Value in this Area
Purchase History
| Date | Buyer | Sale Price | Title Company |
|---|---|---|---|
| Do Thu Hong | $215,000 | Benefit Land Title Company | |
| Ardon Jose Miguel | -- | -- | |
| Ardon Jose Miguel | $155,500 | -- |
Source: Public Records
Mortgage History
| Date | Status | Borrower | Loan Amount |
|---|---|---|---|
| Closed | Do Thu Hong | $114,900 | |
| Previous Owner | Ardon Jose Miguel | $152,782 |
Source: Public Records
Tax History Compared to Growth
Tax History
| Year | Tax Paid | Tax Assessment Tax Assessment Total Assessment is a certain percentage of the fair market value that is determined by local assessors to be the total taxable value of land and additions on the property. | Land | Improvement |
|---|---|---|---|---|
| 2025 | $3,846 | $323,808 | $238,201 | $85,607 |
| 2024 | $3,846 | $317,459 | $233,530 | $83,929 |
| 2023 | $3,772 | $311,235 | $228,951 | $82,284 |
| 2022 | $3,685 | $305,133 | $224,462 | $80,671 |
| 2021 | $3,634 | $299,150 | $220,060 | $79,090 |
| 2020 | $3,589 | $296,083 | $217,803 | $78,280 |
| 2019 | $3,542 | $290,278 | $213,532 | $76,746 |
| 2018 | $3,454 | $284,587 | $209,345 | $75,242 |
| 2017 | $3,418 | $279,007 | $205,240 | $73,767 |
| 2016 | $3,270 | $273,537 | $201,216 | $72,321 |
| 2015 | $3,226 | $269,429 | $198,194 | $71,235 |
| 2014 | $3,149 | $264,152 | $194,312 | $69,840 |
Source: Public Records
Map
Nearby Homes
- 13322 Euclid St
- 1609 N Parsons Place
- 10886 Lotus Dr
- 11321 Parkgreen Ln Unit 102
- 1114 N Gates St
- 14356 Taft St
- 5317 Silver Dr
- 4832 W 5th St Unit B
- 323 N Euclid St Unit 99
- 4201 W 5th St Unit 314
- 5405 W 4th St
- 14151 Lake St
- 4248 W 5th St
- 526 W Tribella Ct
- 3929 W 5th St Unit 16
- 13611 Glenhaven Dr
- 4518 W 1st St
- 3932 W 5th St Unit 202
- 5114 W 1st St Unit C
- 5112 W 1st St Unit C
- 4902 Bruce Ave
- 1121 Sheffield St
- 1117 Sheffield St
- 4905 Oakfield Ave
- 4909 Oakfield Ave
- 4822 Bruce Ave
- 4901 Oakfield Ave
- 4901 Bruce Ave
- 1205 Sheffield St
- 1113 Sheffield St
- 4821 Bruce Ave
- 4821 Oakfield Ave
- 4818 Bruce Ave
- 4906 W Maurie Ave
- 4910 W Maurie Ave
- 4925 Kenny Cir
- 4926 Kenny Cir
- 4906 Oakfield Ave
- 4902 W Maurie Ave
- 4817 Oakfield Ave