4908 Roberts Rd Blackshear, GA 31516
Estimated Value: $332,058 - $388,000
3
Beds
2
Baths
1,697
Sq Ft
$214/Sq Ft
Est. Value
About This Home
This home is located at 4908 Roberts Rd, Blackshear, GA 31516 and is currently estimated at $363,265, approximately $214 per square foot. 4908 Roberts Rd is a home located in Pierce County with nearby schools including Pierce County High School, Southeast Christian Academy, and Truth Christian Academy.
Ownership History
Date
Name
Owned For
Owner Type
Purchase Details
Closed on
Aug 26, 2024
Sold by
Carden Ty B
Bought by
Coppi Christopher and Coppi Stefanie
Current Estimated Value
Home Financials for this Owner
Home Financials are based on the most recent Mortgage that was taken out on this home.
Original Mortgage
$348,570
Outstanding Balance
$343,913
Interest Rate
6.78%
Mortgage Type
FHA
Estimated Equity
$19,352
Purchase Details
Closed on
Jun 20, 1994
Sold by
Bennett J Baxter
Bought by
Carden Ty B and Lauren Denise
Purchase Details
Closed on
Mar 7, 1994
Sold by
Bennett Baxter
Bought by
Carden Ty and Carden Denise
Purchase Details
Closed on
Nov 26, 1958
Sold by
Bennett Mable J
Bought by
Bennett J Baxter
Purchase Details
Closed on
Mar 21, 1934
Sold by
Summerall James
Bought by
James Duncan R
Create a Home Valuation Report for This Property
The Home Valuation Report is an in-depth analysis detailing your home's value as well as a comparison with similar homes in the area
Home Values in the Area
Average Home Value in this Area
Purchase History
| Date | Buyer | Sale Price | Title Company |
|---|---|---|---|
| Coppi Christopher | $355,000 | -- | |
| Carden Ty B | -- | -- | |
| Carden Ty | $10,000 | -- | |
| Bennett J Baxter | -- | -- | |
| James Duncan R | -- | -- |
Source: Public Records
Mortgage History
| Date | Status | Borrower | Loan Amount |
|---|---|---|---|
| Open | Coppi Christopher | $348,570 |
Source: Public Records
Tax History
| Year | Tax Paid | Tax Assessment Tax Assessment Total Assessment is a certain percentage of the fair market value that is determined by local assessors to be the total taxable value of land and additions on the property. | Land | Improvement |
|---|---|---|---|---|
| 2025 | $2,286 | $93,896 | $11,938 | $81,958 |
| 2024 | $1,099 | $90,457 | $11,938 | $78,519 |
| 2023 | $1,099 | $89,976 | $11,938 | $78,038 |
| 2022 | $1,052 | $70,467 | $12,580 | $57,887 |
| 2021 | $1,031 | $68,165 | $12,580 | $55,585 |
| 2020 | $1,048 | $65,863 | $12,580 | $53,283 |
| 2019 | $1,055 | $65,863 | $12,580 | $53,283 |
| 2018 | $1,052 | $62,963 | $11,982 | $50,981 |
| 2017 | $1,684 | $61,306 | $11,982 | $49,324 |
| 2016 | $1,053 | $61,306 | $11,982 | $49,324 |
| 2015 | $1,014 | $61,305 | $11,982 | $49,324 |
| 2014 | $1,014 | $61,306 | $11,982 | $49,324 |
| 2013 | $1,014 | $61,305 | $11,981 | $49,324 |
Source: Public Records
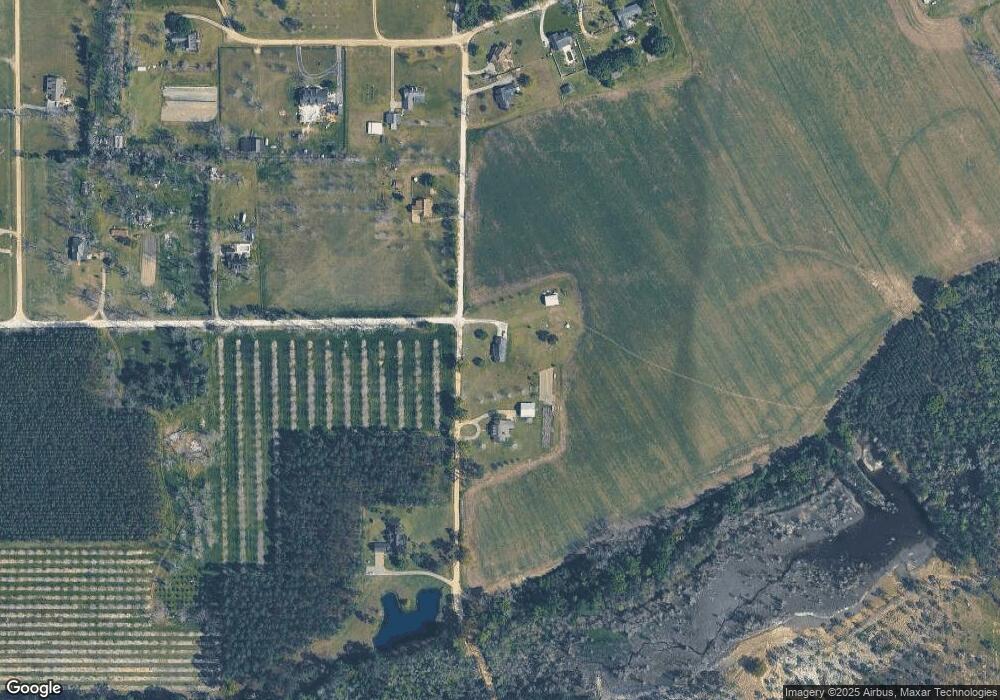
Map
Nearby Homes
- 5605 Woodstone Dr
- 3551 Cason Rd
- 3344 Strickland Ave
- 3360 Strickland Avenue Extension
- 3019 Aragon Ct
- 106 Southern Oaks Ln
- 402 Mcgregor St
- 2936 Piney Grove Cir
- 6034 Turkey Oak Rd
- 940 Gordon St
- 315 Strickland Ave
- 241 Strickland Ave
- 00 Yeomans St
- 4055 Tamrose Ct
- 3026 Aragon Ct
- 501 Watson St
- 331 Central Ave W
- 420 Greenleaf St
- 543 Church St
- 121 Beaver Dr
- 4928 Roberts Rd
- 3695 James Loop
- 4953 Roberts Rd
- 3711 James Loop
- 3110 Sheri Ln
- 3612 James Loop
- 3729 James Loop
- 3134 Sheri Ln
- 3739 James Loop
- 3601 James Loop
- 3756 James Loop
- 3109 Sheri Ln
- 5042 Roberts Rd
- 3748 James Loop
- 3125 Sheri Ln
- S Georgia 121
- 3758 James Loop
- 3586 James Loop
- 3145 Sheri Ln
- 3152 Sheri Ln
Your Personal Tour Guide
Ask me questions while you tour the home.