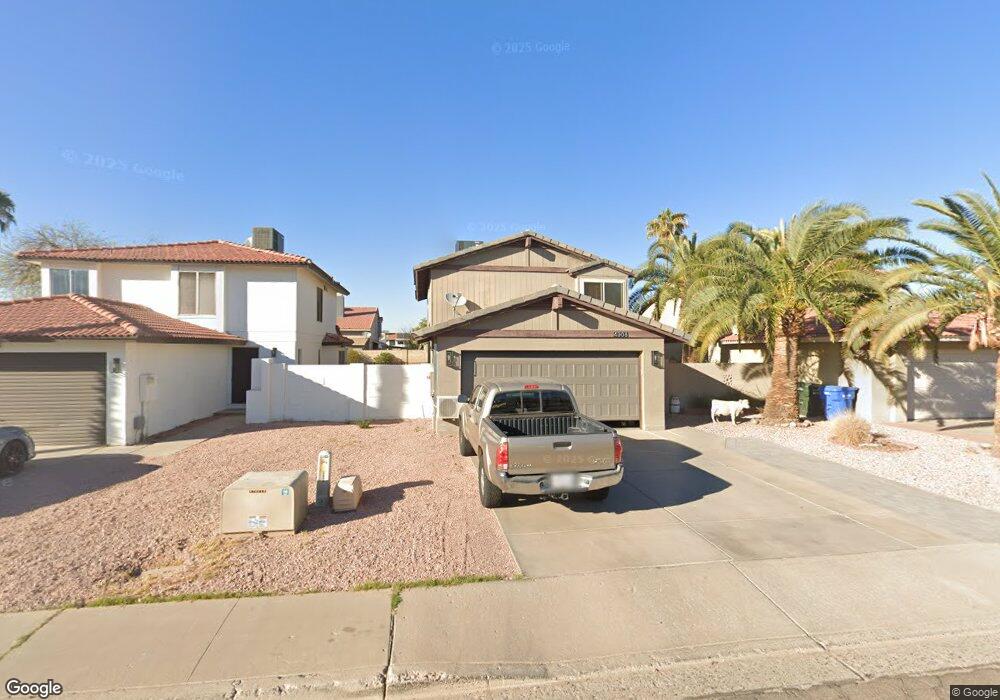
4908 W Gelding Dr Glendale, AZ 85306
Deer Valley NeighborhoodEstimated Value: $306,233 - $393,000
--
Bed
3
Baths
1,617
Sq Ft
$220/Sq Ft
Est. Value
About This Home
This home is located at 4908 W Gelding Dr, Glendale, AZ 85306 and is currently estimated at $356,058, approximately $220 per square foot. 4908 W Gelding Dr is a home located in Maricopa County with nearby schools including Sunburst School, Desert Foothills Middle School, and Greenway High School.
Ownership History
Date
Name
Owned For
Owner Type
Purchase Details
Closed on
May 13, 2004
Sold by
Ohara Joseph T and Theresa Weller M
Bought by
Ohara Joseph T and Ohara Theresa
Current Estimated Value
Home Financials for this Owner
Home Financials are based on the most recent Mortgage that was taken out on this home.
Original Mortgage
$110,400
Outstanding Balance
$58,553
Interest Rate
7.4%
Mortgage Type
New Conventional
Estimated Equity
$297,505
Purchase Details
Closed on
May 23, 1995
Sold by
Wirth Bradley E
Bought by
Ohara Joseph T and Theresa Weller M
Home Financials for this Owner
Home Financials are based on the most recent Mortgage that was taken out on this home.
Original Mortgage
$18,135
Interest Rate
8.32%
Purchase Details
Closed on
Mar 23, 1994
Sold by
Rosen Bernard
Bought by
Ohara Joseph T and Theresa Weller M
Home Financials for this Owner
Home Financials are based on the most recent Mortgage that was taken out on this home.
Original Mortgage
$89,110
Interest Rate
7.84%
Mortgage Type
FHA
Create a Home Valuation Report for This Property
The Home Valuation Report is an in-depth analysis detailing your home's value as well as a comparison with similar homes in the area
Home Values in the Area
Average Home Value in this Area
Purchase History
| Date | Buyer | Sale Price | Title Company |
|---|---|---|---|
| Ohara Joseph T | -- | Chicago Title Insurance Co | |
| Ohara Joseph T | -- | Grand Canyon Title Agency | |
| Wirth Bradley E | -- | Grand Canyon Title Agency | |
| Ohara Joseph T | $89,800 | United Title Agency |
Source: Public Records
Mortgage History
| Date | Status | Borrower | Loan Amount |
|---|---|---|---|
| Open | Ohara Joseph T | $110,400 | |
| Closed | Ohara Joseph T | $18,135 | |
| Previous Owner | Ohara Joseph T | $89,110 | |
| Closed | Ohara Joseph T | $27,600 |
Source: Public Records
Tax History Compared to Growth
Tax History
| Year | Tax Paid | Tax Assessment Tax Assessment Total Assessment is a certain percentage of the fair market value that is determined by local assessors to be the total taxable value of land and additions on the property. | Land | Improvement |
|---|---|---|---|---|
| 2025 | $1,407 | $13,132 | -- | -- |
| 2024 | $1,380 | $12,507 | -- | -- |
| 2023 | $1,380 | $28,670 | $5,730 | $22,940 |
| 2022 | $1,331 | $22,080 | $4,410 | $17,670 |
| 2021 | $1,365 | $19,330 | $3,860 | $15,470 |
| 2020 | $1,328 | $18,180 | $3,630 | $14,550 |
| 2019 | $1,304 | $17,500 | $3,500 | $14,000 |
| 2018 | $1,267 | $16,010 | $3,200 | $12,810 |
| 2017 | $1,263 | $14,110 | $2,820 | $11,290 |
| 2016 | $1,241 | $13,420 | $2,680 | $10,740 |
| 2015 | $1,151 | $12,850 | $2,570 | $10,280 |
Source: Public Records
Map
Nearby Homes
- 4918 W Evans Dr
- 4901 W Gelding Dr
- 5117 W Crocus Dr
- 14207 N 51st Dr Unit 15
- 14002 N 49th Ave Unit 1027
- 14002 N 49th Ave Unit 1038
- 14002 N 49th Ave Unit 1061
- 14034 N 48th Ave
- 5209 W Mauna Loa Ln
- 5220 W Mauna Loa Ln
- 5234 W Banff Ln
- 13810 N 48th Ave
- 4601 W Redfield Rd
- 5306 W Mauna Loa Ln
- 4635 W Boca Raton Rd
- 5219 W Caribbean Ln
- 4444 W Evans Dr
- 5416 W Hearn Rd
- 4411 W Acoma Dr
- 5402 W Country Gables Dr
- 4906 W Gelding Dr
- 4902 W Gelding Dr
- 4914 W Gelding Dr
- 4909 W Evans Dr
- 4907 W Evans Dr
- 4913 W Evans Dr
- 4915 W Evans Dr
- 4920 W Gelding Dr
- 4919 W Evans Dr
- 4911 W Gelding Dr
- 4907 W Gelding Dr
- 14249 N 49th Dr
- 4905 W Gelding Dr
- 4913 W Gelding Dr
- 4844 W Gelding Dr
- 4921 W Evans Dr
- 14245 N 49th Dr
- 4924 W Gelding Dr
- 4845 W Gelding Dr