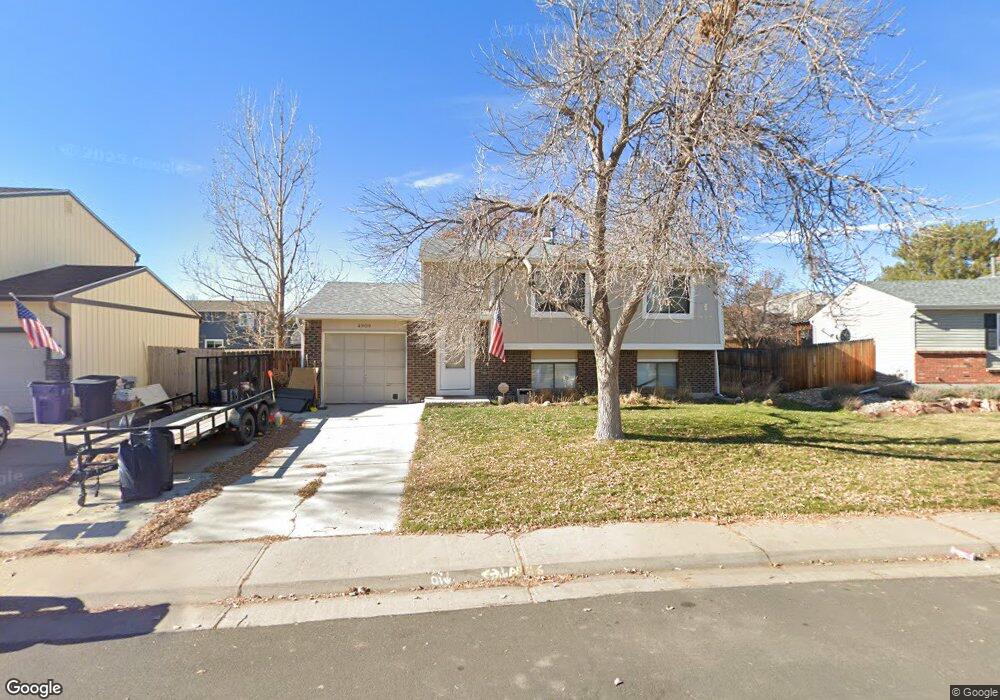
4909 S Flower Way Littleton, CO 80123
Marston NeighborhoodEstimated Value: $526,066 - $581,000
3
Beds
2
Baths
1,567
Sq Ft
$355/Sq Ft
Est. Value
About This Home
This home is located at 4909 S Flower Way, Littleton, CO 80123 and is currently estimated at $556,517, approximately $355 per square foot. 4909 S Flower Way is a home located in Denver County with nearby schools including Grant Ranch School, John F Kennedy High School, and Montessori Peaks Academy.
Ownership History
Date
Name
Owned For
Owner Type
Purchase Details
Closed on
Feb 26, 2018
Sold by
Alcock Thomas R
Bought by
Sanchez Tyler M
Current Estimated Value
Home Financials for this Owner
Home Financials are based on the most recent Mortgage that was taken out on this home.
Original Mortgage
$300,000
Outstanding Balance
$254,657
Interest Rate
3.99%
Mortgage Type
New Conventional
Estimated Equity
$301,860
Purchase Details
Closed on
Aug 30, 2001
Sold by
Callahan Daniel
Bought by
Alcock Thomas R
Home Financials for this Owner
Home Financials are based on the most recent Mortgage that was taken out on this home.
Original Mortgage
$183,126
Interest Rate
6.98%
Mortgage Type
FHA
Purchase Details
Closed on
Nov 28, 1997
Sold by
Gutierrez Carol A
Bought by
Callahan Daniel
Home Financials for this Owner
Home Financials are based on the most recent Mortgage that was taken out on this home.
Original Mortgage
$117,050
Interest Rate
7.3%
Create a Home Valuation Report for This Property
The Home Valuation Report is an in-depth analysis detailing your home's value as well as a comparison with similar homes in the area
Home Values in the Area
Average Home Value in this Area
Purchase History
| Date | Buyer | Sale Price | Title Company |
|---|---|---|---|
| Sanchez Tyler M | $360,000 | Heritage Title Co | |
| Alcock Thomas R | $186,000 | First American Heritage Titl | |
| Callahan Daniel | $121,000 | Stewart Title |
Source: Public Records
Mortgage History
| Date | Status | Borrower | Loan Amount |
|---|---|---|---|
| Open | Sanchez Tyler M | $300,000 | |
| Previous Owner | Alcock Thomas R | $183,126 | |
| Previous Owner | Callahan Daniel | $117,050 |
Source: Public Records
Tax History Compared to Growth
Tax History
| Year | Tax Paid | Tax Assessment Tax Assessment Total Assessment is a certain percentage of the fair market value that is determined by local assessors to be the total taxable value of land and additions on the property. | Land | Improvement |
|---|---|---|---|---|
| 2024 | $2,424 | $30,600 | $1,160 | $29,440 |
| 2023 | $2,371 | $30,600 | $1,160 | $29,440 |
| 2022 | $2,037 | $25,620 | $5,020 | $20,600 |
| 2021 | $1,967 | $26,360 | $5,170 | $21,190 |
| 2020 | $1,873 | $25,250 | $5,170 | $20,080 |
| 2019 | $1,821 | $25,250 | $5,170 | $20,080 |
| 2018 | $1,569 | $20,280 | $4,730 | $15,550 |
| 2017 | $1,564 | $20,280 | $4,730 | $15,550 |
| 2016 | $1,458 | $17,880 | $4,712 | $13,168 |
| 2015 | $1,397 | $17,880 | $4,712 | $13,168 |
| 2014 | $1,279 | $15,400 | $3,980 | $11,420 |
Source: Public Records
Map
Nearby Homes
- 4900 S Garrison St
- 4899 S Dudley St Unit E1
- 4899 S Dudley St Unit 11A
- 4899 S Dudley St Unit 2
- 4899 S Dudley St Unit 4H
- 4899 S Dudley St Unit 14F
- 4896 S Dudley St Unit 10-7
- 4896 S Dudley St Unit 9-10
- 4896 S Dudley St Unit 7-7
- 4896 S Dudley St Unit 8-2
- 4753 S Gar Way
- 8644 W Progress Place
- 9151 W Temple Place
- 8896 W Prentice Ave
- 5264 S Jellison St
- 9614 W Arlington Ave
- 5341 S Cody St
- 5307 S Cody St
- 9975 W Wagon Trail Dr
- 5310 S Jellison St
- 4901 S Flower Way
- 4917 S Flower Way
- 4960 S Garrison St
- 4990 S Garrison St
- 5020 S Garrison St
- 4893 S Flower Way
- 4925 S Flower Way
- 4914 S Flower Way
- 4930 S Garrison St
- 4904 S Flower Way
- 5040 S Garrison St
- 4885 S Flower Way
- 4894 S Flower Way
- 4933 S Flower Way
- 5050 S Garrison St
- 4890 S Garrison St
- 5001 S Garrison St
- 4991 S Garrison St
- 4961 S Garrison St
- 4937 S Field Ct