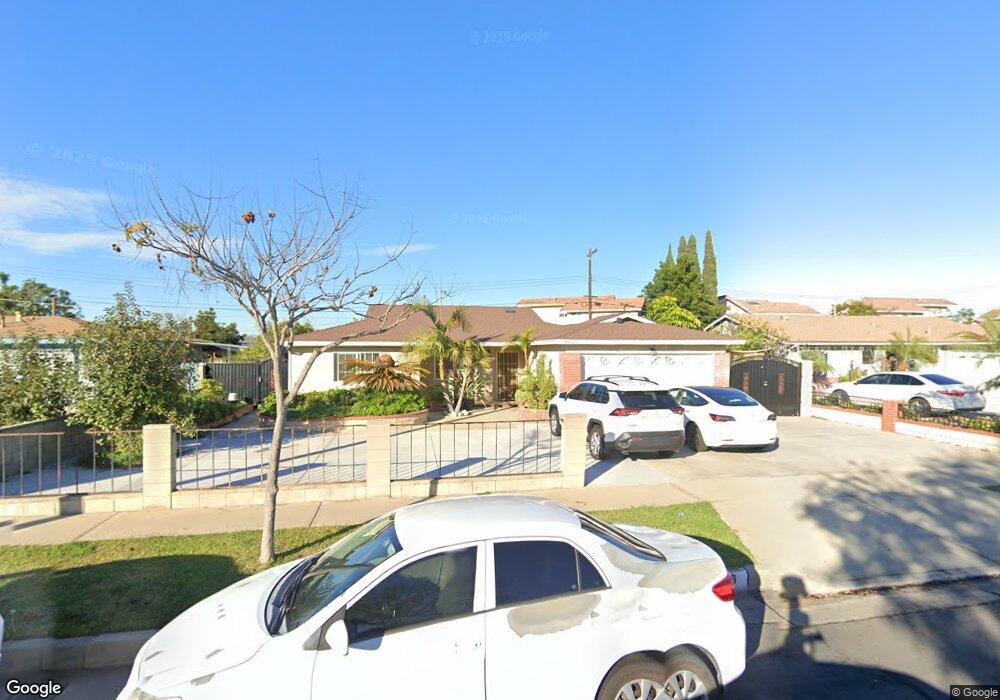
4909 W Maurie Ave Santa Ana, CA 92703
Riverview West NeighborhoodEstimated Value: $780,000 - $1,031,000
4
Beds
2
Baths
1,309
Sq Ft
$695/Sq Ft
Est. Value
About This Home
This home is located at 4909 W Maurie Ave, Santa Ana, CA 92703 and is currently estimated at $910,210, approximately $695 per square foot. 4909 W Maurie Ave is a home located in Orange County with nearby schools including Rosita Elementary School, James Irvine Intermediate School, and Bolsa Grande High School.
Ownership History
Date
Name
Owned For
Owner Type
Purchase Details
Closed on
Apr 1, 2002
Sold by
Luong Nguu and Tran Ngoc
Bought by
Tran Son and Pham Anh Kim
Current Estimated Value
Home Financials for this Owner
Home Financials are based on the most recent Mortgage that was taken out on this home.
Original Mortgage
$200,000
Outstanding Balance
$82,732
Interest Rate
6.78%
Estimated Equity
$827,479
Purchase Details
Closed on
Oct 14, 1999
Sold by
Lahoangoanh
Bought by
Luong Nguu and Tran Ngoc
Home Financials for this Owner
Home Financials are based on the most recent Mortgage that was taken out on this home.
Original Mortgage
$162,400
Interest Rate
7.75%
Purchase Details
Closed on
Aug 17, 1994
Sold by
Vu Hoe Ngoc
Bought by
Lahoang Oanh Thi
Purchase Details
Closed on
Jul 30, 1993
Sold by
Reeder Joan N
Bought by
Vu Hoe Ngoc
Home Financials for this Owner
Home Financials are based on the most recent Mortgage that was taken out on this home.
Original Mortgage
$108,000
Interest Rate
7.28%
Create a Home Valuation Report for This Property
The Home Valuation Report is an in-depth analysis detailing your home's value as well as a comparison with similar homes in the area
Home Values in the Area
Average Home Value in this Area
Purchase History
| Date | Buyer | Sale Price | Title Company |
|---|---|---|---|
| Tran Son | -- | South Coast Title | |
| Luong Nguu | $203,000 | Southland Title Corporation | |
| Lahoang Oanh Thi | -- | -- | |
| Vu Hoe Ngoc | $135,000 | Benefit Land Title Co |
Source: Public Records
Mortgage History
| Date | Status | Borrower | Loan Amount |
|---|---|---|---|
| Open | Tran Son | $200,000 | |
| Closed | Luong Nguu | $162,400 | |
| Previous Owner | Vu Hoe Ngoc | $108,000 |
Source: Public Records
Tax History Compared to Growth
Tax History
| Year | Tax Paid | Tax Assessment Tax Assessment Total Assessment is a certain percentage of the fair market value that is determined by local assessors to be the total taxable value of land and additions on the property. | Land | Improvement |
|---|---|---|---|---|
| 2025 | $3,869 | $325,881 | $244,829 | $81,052 |
| 2024 | $3,869 | $319,492 | $240,029 | $79,463 |
| 2023 | $3,795 | $313,228 | $235,323 | $77,905 |
| 2022 | $3,707 | $307,087 | $230,709 | $76,378 |
| 2021 | $3,655 | $301,066 | $226,185 | $74,881 |
| 2020 | $3,610 | $297,979 | $223,865 | $74,114 |
| 2019 | $3,563 | $292,137 | $219,476 | $72,661 |
| 2018 | $3,474 | $286,409 | $215,172 | $71,237 |
| 2017 | $3,438 | $280,794 | $210,953 | $69,841 |
| 2016 | $3,289 | $275,289 | $206,817 | $68,472 |
| 2015 | $3,245 | $271,154 | $203,710 | $67,444 |
| 2014 | $3,167 | $265,843 | $199,720 | $66,123 |
Source: Public Records
Map
Nearby Homes
- 1609 N Parsons Place
- 13322 Euclid St
- 11321 Parkgreen Ln Unit 102
- 10886 Lotus Dr
- 1114 N Gates St
- 14356 Taft St
- 5317 Silver Dr
- 4832 W 5th St Unit B
- 14151 Lake St
- 4201 W 5th St Unit 314
- 323 N Euclid St Unit 99
- 5405 W 4th St
- 526 W Tribella Ct
- 13611 Glenhaven Dr
- 4248 W 5th St
- 3929 W 5th St Unit 16
- 3932 W 5th St Unit 202
- 4518 W 1st St
- 5114 W 1st St Unit C
- 1314 N Bewley St
- 4905 W Maurie Ave
- 4917 W Maurie Ave
- 21 Cantera
- 4902 Morningside Ave
- 20 Cantera
- 4901 W Maurie Ave
- 4921 W Maurie Ave
- 4906 Morningside Ave
- 4910 W Maurie Ave
- 22 Cantera
- 1401 La Bonita St
- 4906 W Maurie Ave
- 19 Cantera
- 4910 Morningside Ave Unit 22
- 4922 W Maurie Ave
- 5001 W Maurie Ave
- 23 Cantera
- 4902 W Maurie Ave
- 40 Cantera
- 1405 La Bonita St