Estimated Value: $669,000 - $737,000
4
Beds
3
Baths
1,752
Sq Ft
$401/Sq Ft
Est. Value
About This Home
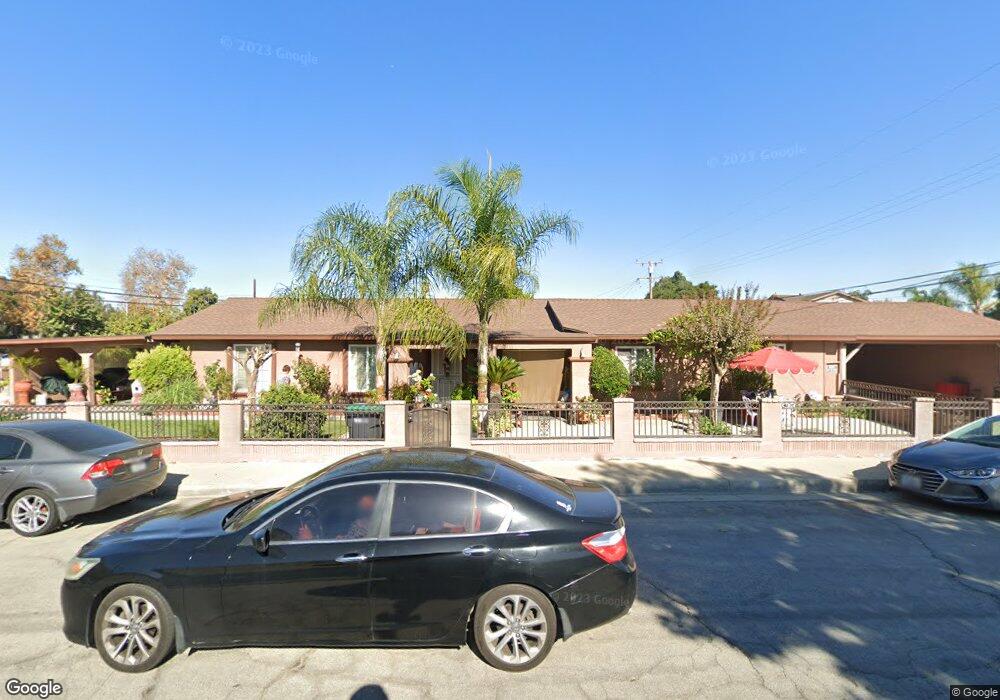
This home is located at 4910 D St, Chino, CA 91710 and is currently estimated at $702,849, approximately $401 per square foot. 4910 D St is a home located in San Bernardino County with nearby schools including Dickson Elementary, Ramona Junior High School, and Don Antonio Lugo High School.
Ownership History
Date
Name
Owned For
Owner Type
Purchase Details
Closed on
Jun 25, 2025
Sold by
Alcaraz Family Revocable Living Trust and Chavez Maricela
Bought by
Jesus Cristo Revocable Living Trust and Chavez
Current Estimated Value
Home Financials for this Owner
Home Financials are based on the most recent Mortgage that was taken out on this home.
Original Mortgage
$350,000
Outstanding Balance
$349,412
Interest Rate
6.89%
Mortgage Type
New Conventional
Estimated Equity
$353,437
Purchase Details
Closed on
Mar 22, 2010
Sold by
Alcaraz Elias and Alcaraz Audelia
Bought by
Alcaraz Elias and Alcaraz Audelia
Purchase Details
Closed on
Jul 8, 1993
Sold by
Alcaraz Elias and Alcaraz Audelia
Bought by
Alcaraz Elias and Alcaraz Audelia
Home Financials for this Owner
Home Financials are based on the most recent Mortgage that was taken out on this home.
Original Mortgage
$54,927
Interest Rate
7.25%
Mortgage Type
FHA
Create a Home Valuation Report for This Property
The Home Valuation Report is an in-depth analysis detailing your home's value as well as a comparison with similar homes in the area
Home Values in the Area
Average Home Value in this Area
Purchase History
| Date | Buyer | Sale Price | Title Company |
|---|---|---|---|
| Jesus Cristo Revocable Living Trust | -- | Orange Coast Title Company | |
| Alcaraz Elias | -- | None Available | |
| Alcaraz Elias | -- | Northern Counties Title |
Source: Public Records
Mortgage History
| Date | Status | Borrower | Loan Amount |
|---|---|---|---|
| Open | Jesus Cristo Revocable Living Trust | $350,000 | |
| Previous Owner | Alcaraz Elias | $54,927 |
Source: Public Records
Tax History
| Year | Tax Paid | Tax Assessment Tax Assessment Total Assessment is a certain percentage of the fair market value that is determined by local assessors to be the total taxable value of land and additions on the property. | Land | Improvement |
|---|---|---|---|---|
| 2025 | $2,079 | $184,693 | $55,260 | $129,433 |
| 2024 | $2,024 | $181,071 | $54,176 | $126,895 |
| 2023 | $1,968 | $177,521 | $53,114 | $124,407 |
| 2022 | $1,957 | $174,041 | $52,073 | $121,968 |
| 2021 | $1,919 | $170,628 | $51,052 | $119,576 |
| 2020 | $1,894 | $168,879 | $50,529 | $118,350 |
| 2019 | $1,861 | $165,567 | $49,538 | $116,029 |
| 2018 | $1,821 | $162,321 | $48,567 | $113,754 |
| 2017 | $1,788 | $159,139 | $47,615 | $111,524 |
| 2016 | $1,672 | $156,018 | $46,681 | $109,337 |
| 2015 | $1,639 | $153,675 | $45,980 | $107,695 |
| 2014 | $1,607 | $150,664 | $45,079 | $105,585 |
Source: Public Records
Map
Nearby Homes
- 13239 2nd St
- 13123 2nd St
- 13257 2nd St
- 13079 Monte Vista Ave
- 13065 San Clemente Ln
- 4912 G St
- 13085 5th St
- 4621 Chino Ave
- 13148 Derby Ave
- 4497 Carmen St
- 4457 Heather Cir
- 4372 Rainier Ct
- 0 C St
- 12629 Thomas Place
- 5039 Tyler St
- 12585 Yorba Ave
- 12620 Anthony Place
- 12488 Monte Vista Ave
- 12608 Ramona Ave
- 5195 Walnut Ave Unit 14
- 13179 Monte Vista Ave
- 13171 Monte Vista Ave
- 13201 Monte Vista Ave
- 13165 Monte Vista Ave
- 13186 2nd St
- 13209 Monte Vista Ave
- 13202 2nd St
- 13215 Monte Vista Ave
- 13166 2nd St
- 13210 2nd St
- 13149 Monte Vista Ave
- 13158 2nd St
- 13216 2nd St
- 13223 Monte Vista Ave Unit B
- 13223 Monte Vista Ave
- 13150 2nd St
- 13224 2nd St
- 13231 Monte Vista Ave
- 13139 Monte Vista Ave
- 13146 Monte Vista Ave
Your Personal Tour Guide
Ask me questions while you tour the home.