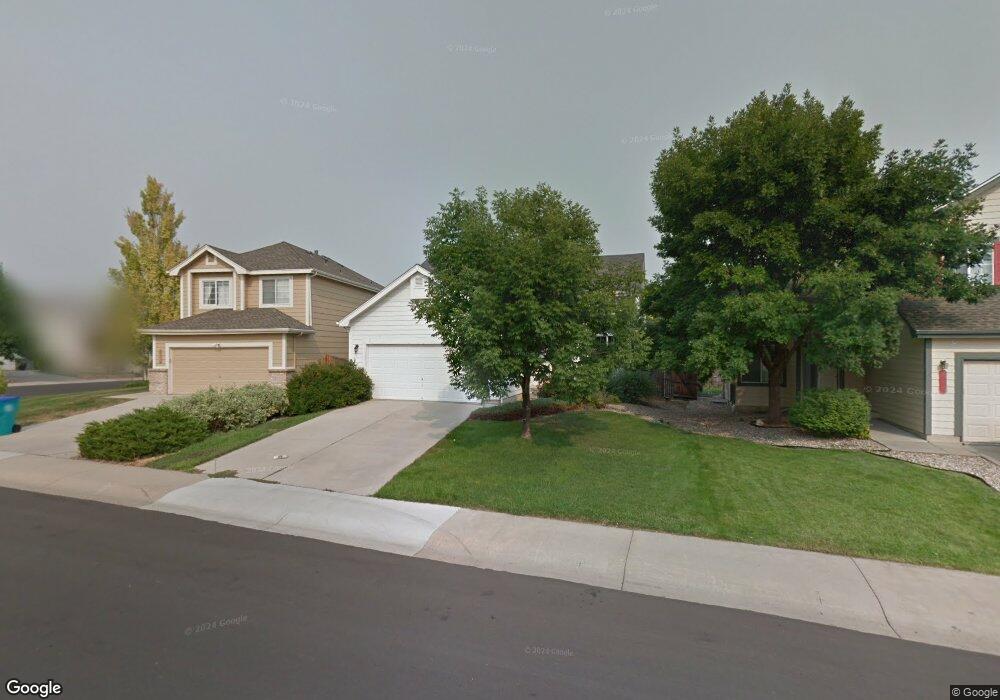
4912 Wilmington Dr Fort Collins, CO 80528
Estimated Value: $480,000 - $505,129
3
Beds
2
Baths
1,555
Sq Ft
$316/Sq Ft
Est. Value
About This Home
This home is located at 4912 Wilmington Dr, Fort Collins, CO 80528 and is currently estimated at $491,282, approximately $315 per square foot. 4912 Wilmington Dr is a home located in Larimer County with nearby schools including Kruse Elementary School, Boltz Middle School, and Fort Collins High School.
Ownership History
Date
Name
Owned For
Owner Type
Purchase Details
Closed on
Sep 21, 2007
Sold by
Murphy Brock A
Bought by
Cashman Neal
Current Estimated Value
Home Financials for this Owner
Home Financials are based on the most recent Mortgage that was taken out on this home.
Original Mortgage
$212,500
Outstanding Balance
$135,160
Interest Rate
6.66%
Mortgage Type
Purchase Money Mortgage
Estimated Equity
$356,122
Purchase Details
Closed on
Feb 7, 2007
Sold by
Melendez Sharon K and Hixson Sharon K
Bought by
Murphy Brock A
Home Financials for this Owner
Home Financials are based on the most recent Mortgage that was taken out on this home.
Original Mortgage
$203,703
Interest Rate
6.19%
Mortgage Type
FHA
Purchase Details
Closed on
Dec 24, 1998
Sold by
U S Home Corp
Bought by
Melendez Sharon K
Home Financials for this Owner
Home Financials are based on the most recent Mortgage that was taken out on this home.
Original Mortgage
$130,000
Interest Rate
6.85%
Purchase Details
Closed on
Dec 1, 1994
Sold by
Richland Development Co Llc
Bought by
Gateway American Properties Llc
Purchase Details
Closed on
May 1, 1994
Sold by
Imago Enterprises Inc
Bought by
Richland Development Co Llc
Create a Home Valuation Report for This Property
The Home Valuation Report is an in-depth analysis detailing your home's value as well as a comparison with similar homes in the area
Home Values in the Area
Average Home Value in this Area
Purchase History
| Date | Buyer | Sale Price | Title Company |
|---|---|---|---|
| Cashman Neal | $212,500 | Land Title Guarantee Company | |
| Murphy Brock A | $206,900 | Fahtco | |
| Melendez Sharon K | $147,685 | Stewart Title | |
| Gateway American Properties Llc | $448,300 | -- | |
| Richland Development Co Llc | $758,800 | -- |
Source: Public Records
Mortgage History
| Date | Status | Borrower | Loan Amount |
|---|---|---|---|
| Open | Cashman Neal | $212,500 | |
| Previous Owner | Murphy Brock A | $203,703 | |
| Previous Owner | Melendez Sharon K | $130,000 |
Source: Public Records
Tax History Compared to Growth
Tax History
| Year | Tax Paid | Tax Assessment Tax Assessment Total Assessment is a certain percentage of the fair market value that is determined by local assessors to be the total taxable value of land and additions on the property. | Land | Improvement |
|---|---|---|---|---|
| 2025 | $3,070 | $35,684 | $3,015 | $32,669 |
| 2024 | $2,921 | $35,684 | $3,015 | $32,669 |
| 2022 | $2,397 | $25,382 | $3,128 | $22,254 |
| 2021 | $2,422 | $26,112 | $3,218 | $22,894 |
| 2020 | $2,297 | $24,546 | $3,218 | $21,328 |
| 2019 | $2,307 | $24,546 | $3,218 | $21,328 |
| 2018 | $1,765 | $19,368 | $3,240 | $16,128 |
| 2017 | $1,759 | $19,368 | $3,240 | $16,128 |
| 2016 | $1,811 | $19,836 | $3,582 | $16,254 |
| 2015 | $1,798 | $19,830 | $3,580 | $16,250 |
| 2014 | $1,540 | $16,880 | $3,580 | $13,300 |
Source: Public Records
Map
Nearby Homes
- 2055 Angelo Dr
- 5121 Stillwater Creek Dr Unit B
- 5225 White Willow Dr Unit F200
- 5225 White Willow Dr Unit N210
- 5225 White Willow Dr Unit J110
- 2120 Timber Creek Dr Unit H4
- 2120 Timber Creek Dr Unit K1
- 2138 Copper Creek Dr Unit B
- 2107 Stillwater Creek Dr
- 2208 Copper Creek Dr Unit A
- 2142 Stetson Creek Dr
- 4913 Smallwood Ct
- 4751 Pleasant Oak Dr Unit C83
- 4751 Pleasant Oak Dr Unit C65
- 2021 Timberline Ln
- 1715 Globe Ct
- 5502 Weeping Way
- 1313 Silk Oak Dr
- 5125 Redbud Ct
- 4414 Monaco Place
- 4918 Wilmington Dr
- 4906 Wilmington Dr
- 1913 Jamison Dr
- 4924 Wilmington Dr
- 1900 Unity Ct
- 1831 Jamison Ct
- 1919 Jamison Dr
- 4930 Wilmington Dr
- 1901 Unity Ct
- 1906 Unity Ct
- 1836 Terrace Ct
- 1925 Jamison Dr
- 4936 Wilmington Dr
- 1825 Jamison Ct
- 1900 Jamison Dr
- 1906 Jamison Dr
- 1912 Jamison Dr
- 1830 Terrace Ct
- 1912 Unity Ct
- 1931 Jamison Dr