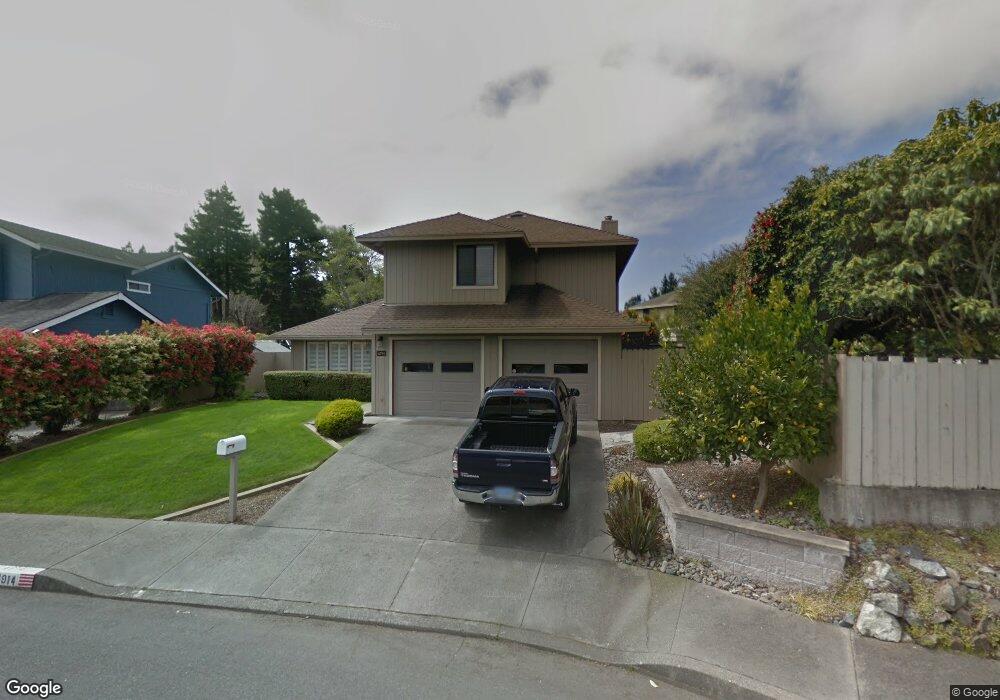
4914 Lundblade Dr Eureka, CA 95503
Estimated Value: $398,209 - $625,000
Studio
--
Bath
--
Sq Ft
6,142
Sq Ft Lot
About This Home
This home is located at 4914 Lundblade Dr, Eureka, CA 95503 and is currently estimated at $497,802. 4914 Lundblade Dr is a home located in Humboldt County with nearby schools including Grant Elementary School, Winship Middle School, and Eureka Senior High School.
Ownership History
Date
Name
Owned For
Owner Type
Purchase Details
Closed on
Nov 1, 2017
Sold by
Breckner Bruce A and Breckner Lynn K
Bought by
Breckner Bruce A and Breckner Lynn K
Current Estimated Value
Purchase Details
Closed on
Dec 20, 2010
Sold by
Breckner Bruce A and Breckner Lynn K
Bought by
Breckner Bruce A and Breckner Lynn K
Home Financials for this Owner
Home Financials are based on the most recent Mortgage that was taken out on this home.
Original Mortgage
$99,500
Interest Rate
4.17%
Mortgage Type
New Conventional
Purchase Details
Closed on
May 12, 2004
Sold by
Breckner Bruce A and Breckner Lynn K
Bought by
Breckner Bruce A and Breckner Lynn K
Create a Home Valuation Report for This Property
The Home Valuation Report is an in-depth analysis detailing your home's value as well as a comparison with similar homes in the area
Purchase History
| Date | Buyer | Sale Price | Title Company |
|---|---|---|---|
| Breckner Bruce A | -- | None Available | |
| Breckner Bruce A | -- | Fidelity Natl Title Co Of Ca | |
| Breckner Bruce A | -- | -- |
Source: Public Records
Mortgage History
| Date | Status | Borrower | Loan Amount |
|---|---|---|---|
| Closed | Breckner Bruce A | $99,500 |
Source: Public Records
Tax History
| Year | Tax Paid | Tax Assessment Tax Assessment Total Assessment is a certain percentage of the fair market value that is determined by local assessors to be the total taxable value of land and additions on the property. | Land | Improvement |
|---|---|---|---|---|
| 2025 | $2,401 | $233,500 | $66,981 | $166,519 |
| 2024 | $2,401 | $228,922 | $65,668 | $163,254 |
| 2023 | $2,368 | $224,434 | $64,381 | $160,053 |
| 2022 | $2,458 | $220,034 | $63,119 | $156,915 |
| 2021 | $2,302 | $215,721 | $61,882 | $153,839 |
| 2020 | $2,285 | $213,510 | $61,248 | $152,262 |
| 2019 | $2,238 | $209,325 | $60,048 | $149,277 |
| 2018 | $2,129 | $205,221 | $58,871 | $146,350 |
| 2017 | $2,117 | $201,198 | $57,717 | $143,481 |
| 2016 | $2,116 | $197,254 | $56,586 | $140,668 |
| 2015 | $2,096 | $194,293 | $55,737 | $138,556 |
| 2014 | $1,958 | $190,488 | $54,646 | $135,842 |
Source: Public Records
Map
Nearby Homes
Your Personal Tour Guide
Ask me questions while you tour the home.