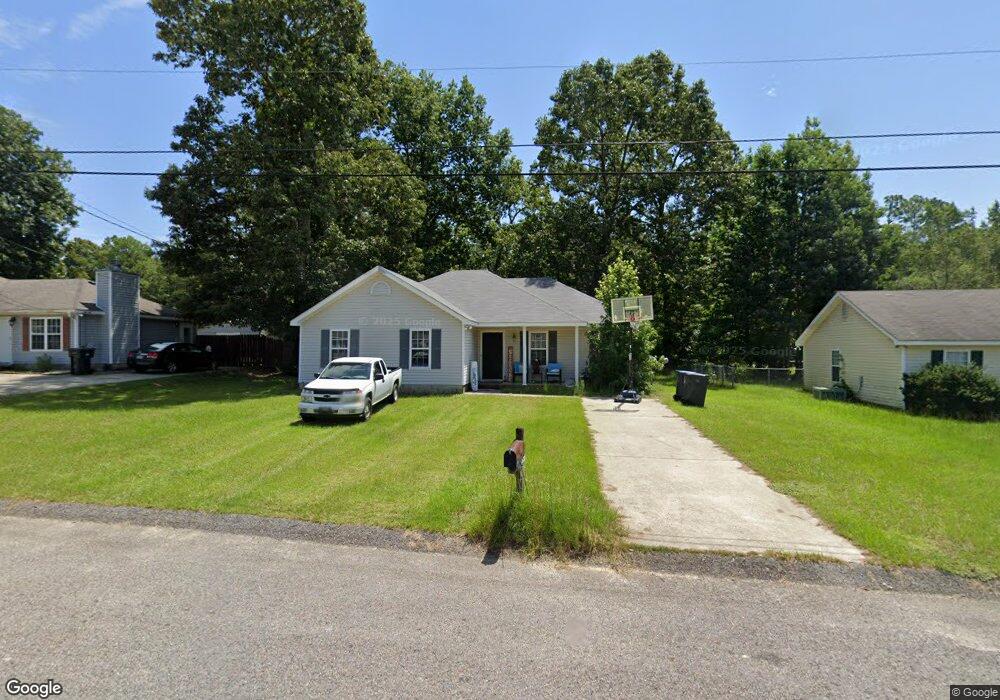
4914 Mossycup Ct Hephzibah, GA 30815
Hancock Mill NeighborhoodEstimated Value: $189,000 - $219,000
4
Beds
2
Baths
1,400
Sq Ft
$147/Sq Ft
Est. Value
About This Home
This home is located at 4914 Mossycup Ct, Hephzibah, GA 30815 and is currently estimated at $206,399, approximately $147 per square foot. 4914 Mossycup Ct is a home located in Richmond County with nearby schools including McBean Elementary School, Pine Hill Middle School, and Johnson Magnet.
Ownership History
Date
Name
Owned For
Owner Type
Purchase Details
Closed on
Jul 29, 2004
Sold by
Queck Ryan P and Queck Jessica A
Bought by
Wilmore Heath A Jermaine and Wilmore Heath Stacy
Current Estimated Value
Home Financials for this Owner
Home Financials are based on the most recent Mortgage that was taken out on this home.
Original Mortgage
$105,061
Outstanding Balance
$52,487
Interest Rate
6.22%
Mortgage Type
VA
Estimated Equity
$153,912
Purchase Details
Closed on
Jul 23, 2002
Sold by
Archway Builders Inc
Bought by
Queck Ryan P and Queck Jessica A
Home Financials for this Owner
Home Financials are based on the most recent Mortgage that was taken out on this home.
Original Mortgage
$85,350
Interest Rate
6.53%
Create a Home Valuation Report for This Property
The Home Valuation Report is an in-depth analysis detailing your home's value as well as a comparison with similar homes in the area
Home Values in the Area
Average Home Value in this Area
Purchase History
| Date | Buyer | Sale Price | Title Company |
|---|---|---|---|
| Wilmore Heath A Jermaine | $102,800 | -- | |
| Queck Ryan P | $88,000 | -- |
Source: Public Records
Mortgage History
| Date | Status | Borrower | Loan Amount |
|---|---|---|---|
| Open | Wilmore Heath A Jermaine | $105,061 | |
| Previous Owner | Queck Ryan P | $85,350 |
Source: Public Records
Tax History Compared to Growth
Tax History
| Year | Tax Paid | Tax Assessment Tax Assessment Total Assessment is a certain percentage of the fair market value that is determined by local assessors to be the total taxable value of land and additions on the property. | Land | Improvement |
|---|---|---|---|---|
| 2025 | $2,418 | $77,496 | $8,000 | $69,496 |
| 2024 | $2,418 | $66,020 | $8,000 | $58,020 |
| 2023 | $1,387 | $62,068 | $8,000 | $54,068 |
| 2022 | $1,795 | $54,988 | $8,000 | $46,988 |
| 2021 | $1,472 | $39,685 | $8,000 | $31,685 |
| 2020 | $1,441 | $39,685 | $8,000 | $31,685 |
| 2019 | $1,518 | $39,685 | $8,000 | $31,685 |
| 2018 | $1,527 | $39,685 | $8,000 | $31,685 |
| 2017 | $1,484 | $39,685 | $8,000 | $31,685 |
| 2016 | $1,485 | $39,685 | $8,000 | $31,685 |
| 2015 | $1,494 | $39,685 | $8,000 | $31,685 |
| 2014 | $1,496 | $39,685 | $8,000 | $31,685 |
Source: Public Records
Map
Nearby Homes
- 1515D Hephzibah - McBean Rd
- 1515F Hephzibah - McBean Rd
- 1515C Hephzibah - McBean Rd
- 1515G Hephzibah - McBean Rd
- 1515H Hephzibah - McBean Rd
- 1436 Hephzibah - McBean Rd Unit 1
- 1515B Hephzibah - McBean Rd
- Hephzibah Unit McBean Road
- 2010 McCoy Mill Rd
- 1027 Grindstone Creek Rd
- 1530 Keron Way
- 5209 Neely Rd
- 1290 Hephzibah - McBean Rd
- 4653 Hunters Mill Ct
- 2073 C Broome Rd
- 4734 Tinley Rd
- 5007 Peach Orchard Rd
- 1469 Clark Rd
- 1123 Hephzibah - McBean Rd
- 2018 Broome Rd
- 4912 Mossycup Ct
- 4916 Mossycup Ct
- 4913 Mossycup Ct
- 4915 Mossycup Ct
- 4910 Mossycup Ct
- 4911 Mossycup Ct
- 4918 Mossycup Ct
- 4917 Mossycup Ct
- 4909 Mossycup Ct
- 4920 Mossycup Ct
- 4908 Mossycup Ct
- 4906 Mossycup Ct
- 4922 Mossycup Ct
- 4905 Mossycup Ct
- 4904 Mossycup Ct
- 4903 Mossycup Ct
- 4923 Mossycup Ct
- 4902 Mossycup Ct
- 1485 Hephzibah McBean Rd
- 1495 Hephzibah - McBean Rd