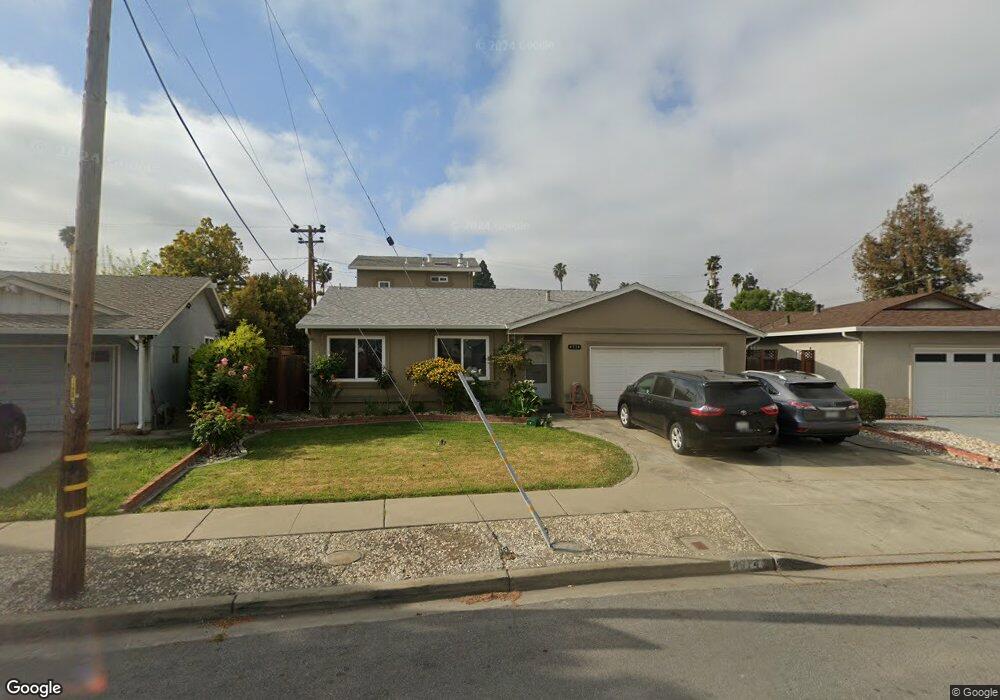
4914 Nelson St Fremont, CA 94538
Sundale NeighborhoodEstimated Value: $1,311,000 - $1,940,922
4
Beds
4
Baths
2,573
Sq Ft
$651/Sq Ft
Est. Value
About This Home
This home is located at 4914 Nelson St, Fremont, CA 94538 and is currently estimated at $1,674,731, approximately $650 per square foot. 4914 Nelson St is a home located in Alameda County with nearby schools including Joseph Azevada Elementary School, G.M. Walters Middle School, and John F. Kennedy High School.
Ownership History
Date
Name
Owned For
Owner Type
Purchase Details
Closed on
Dec 18, 2014
Sold by
Wang Chien Chun and Wang Yueh Yuen Wu
Bought by
Chuang Alice
Current Estimated Value
Purchase Details
Closed on
Sep 17, 2010
Sold by
Wang Chien Chun and Wang Yueh Yuen
Bought by
Wang Chien Chun and Wang Yueh Yuen
Purchase Details
Closed on
Jul 24, 2007
Sold by
Lawson James
Bought by
Lawson Jennifer A
Home Financials for this Owner
Home Financials are based on the most recent Mortgage that was taken out on this home.
Original Mortgage
$417,000
Interest Rate
6.75%
Mortgage Type
Purchase Money Mortgage
Purchase Details
Closed on
Jul 13, 2007
Sold by
Lawson Jennifer A and Lawson Allan Jennifer
Bought by
Wang Chien Chun and Wang Yueh Yuen
Home Financials for this Owner
Home Financials are based on the most recent Mortgage that was taken out on this home.
Original Mortgage
$417,000
Interest Rate
6.75%
Mortgage Type
Purchase Money Mortgage
Purchase Details
Closed on
Feb 6, 2000
Sold by
Allan Breton R and Allan Jennifer
Bought by
Allan Jennifer Anne
Create a Home Valuation Report for This Property
The Home Valuation Report is an in-depth analysis detailing your home's value as well as a comparison with similar homes in the area
Home Values in the Area
Average Home Value in this Area
Purchase History
| Date | Buyer | Sale Price | Title Company |
|---|---|---|---|
| Chuang Alice | -- | None Available | |
| Wang Chien Chun | -- | None Available | |
| Lawson Jennifer A | -- | Chicago Title Co | |
| Wang Chien Chun | $661,500 | Chicago Title Co | |
| Allan Jennifer Anne | -- | -- |
Source: Public Records
Mortgage History
| Date | Status | Borrower | Loan Amount |
|---|---|---|---|
| Previous Owner | Wang Chien Chun | $417,000 |
Source: Public Records
Tax History
| Year | Tax Paid | Tax Assessment Tax Assessment Total Assessment is a certain percentage of the fair market value that is determined by local assessors to be the total taxable value of land and additions on the property. | Land | Improvement |
|---|---|---|---|---|
| 2025 | $11,775 | $986,475 | $328,357 | $665,118 |
| 2024 | $11,775 | $966,998 | $321,920 | $652,078 |
| 2023 | $11,463 | $954,907 | $315,610 | $639,297 |
| 2022 | $11,319 | $929,186 | $309,422 | $626,764 |
| 2021 | $11,062 | $912,855 | $303,357 | $616,498 |
| 2020 | $11,112 | $910,425 | $300,247 | $610,178 |
| 2019 | $10,983 | $892,581 | $294,362 | $598,219 |
| 2018 | $10,769 | $875,085 | $288,592 | $586,493 |
| 2017 | $10,499 | $857,931 | $282,935 | $574,996 |
| 2016 | $10,323 | $841,109 | $277,387 | $563,722 |
| 2015 | $10,188 | $828,480 | $273,222 | $555,258 |
| 2014 | $10,097 | $812,257 | $267,872 | $544,385 |
Source: Public Records
Map
Nearby Homes
- 39630 Blacow Rd
- 39511 Pardee Ct
- 4833 Murphy Ct
- 4657 Pardee Ave
- 5132 Trade Wind Ln
- 4600 Nelson St
- 4714 Serra Ave
- 39151 Donner Way
- 4754 Bret Harte Ct
- 5592 Dewey Place
- 4588 Sloat Rd
- 4369 Amador Rd
- 39904 Lindsay Mcdermott Ln Unit 8
- 40327 Blacow Rd
- 4859 Hilo St
- 39583 Buena Vista Terrace
- 38952 Emrol Ave
- 40422 Landon Ave
- 4560 Piper St
- 4478 English Rose Common
- 4906 Nelson St
- 4920 Nelson St
- 4898 Nelson St
- 4910 Folsum Way
- 4897 Nelson St
- 4918 Folsum Way
- 39535 Yuba Ct
- 4890 Nelson St
- 4915 Nelson St
- 4941 Coco Palm Dr
- 4959 Coco Palm Dr
- 39538 Blacow Rd
- 4923 Coco Palm Dr
- 39551 Yuba Ct
- 4882 Nelson St
- 4977 Coco Palm Dr
- 39512 Blacow Rd
- 4926 Folsum Way
- 4923 Nelson St
- 4905 Coco Palm Dr
Your Personal Tour Guide
Ask me questions while you tour the home.