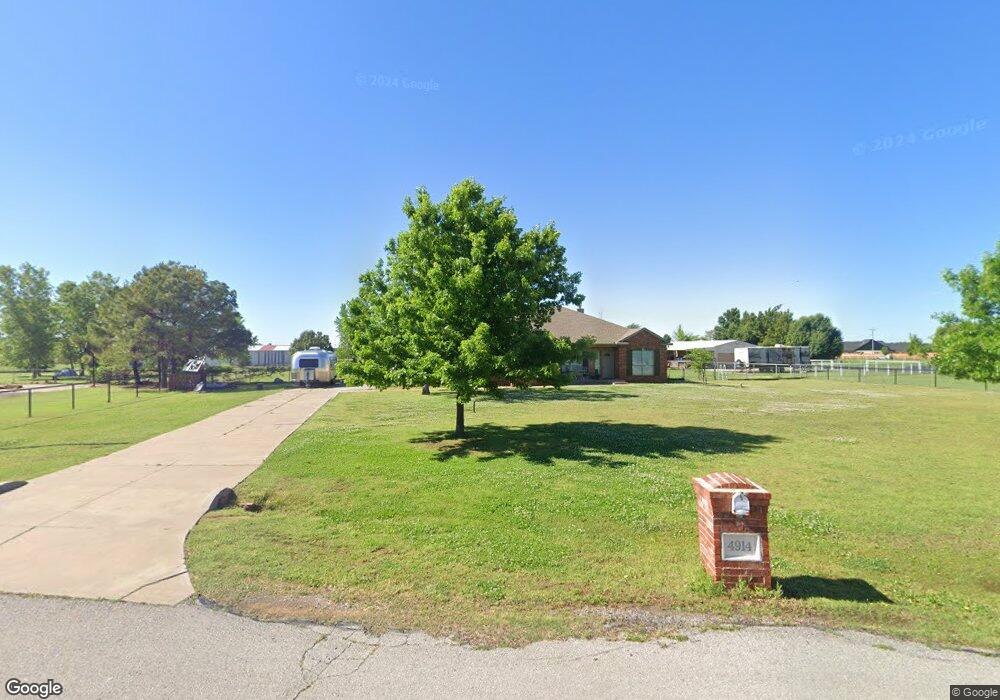
4914 Penn Place Dr Edmond, OK 73025
Estimated Value: $344,467 - $399,000
4
Beds
2
Baths
1,999
Sq Ft
$182/Sq Ft
Est. Value
About This Home
This home is located at 4914 Penn Place Dr, Edmond, OK 73025 and is currently estimated at $364,617, approximately $182 per square foot. 4914 Penn Place Dr is a home with nearby schools including Prairie Vale Elementary School, Deer Creek Middle School, and Deer Creek Intermediate School.
Ownership History
Date
Name
Owned For
Owner Type
Purchase Details
Closed on
Sep 28, 2010
Sold by
National Residential Nominee Services In
Bought by
Branda Chris D and Branda Alicia M
Current Estimated Value
Home Financials for this Owner
Home Financials are based on the most recent Mortgage that was taken out on this home.
Original Mortgage
$167,500
Outstanding Balance
$110,268
Interest Rate
4.38%
Mortgage Type
New Conventional
Estimated Equity
$254,349
Purchase Details
Closed on
Aug 12, 2010
Sold by
Nowell Brent and Nowell Gledis
Bought by
National Residential Nominee Services In
Home Financials for this Owner
Home Financials are based on the most recent Mortgage that was taken out on this home.
Original Mortgage
$167,500
Outstanding Balance
$110,268
Interest Rate
4.38%
Mortgage Type
New Conventional
Estimated Equity
$254,349
Purchase Details
Closed on
Dec 5, 2005
Sold by
Dodd Richard Kent and Dodd Loretta Marcel
Bought by
Nowell Brent and Nowell Gledia
Create a Home Valuation Report for This Property
The Home Valuation Report is an in-depth analysis detailing your home's value as well as a comparison with similar homes in the area
Home Values in the Area
Average Home Value in this Area
Purchase History
| Date | Buyer | Sale Price | Title Company |
|---|---|---|---|
| Branda Chris D | $186,500 | Capitol Abstract | |
| National Residential Nominee Services In | $186,500 | Capitol Abstract And Title C | |
| Nowell Brent | $29,000 | None Available |
Source: Public Records
Mortgage History
| Date | Status | Borrower | Loan Amount |
|---|---|---|---|
| Open | Branda Chris D | $167,500 |
Source: Public Records
Tax History Compared to Growth
Tax History
| Year | Tax Paid | Tax Assessment Tax Assessment Total Assessment is a certain percentage of the fair market value that is determined by local assessors to be the total taxable value of land and additions on the property. | Land | Improvement |
|---|---|---|---|---|
| 2025 | $3,138 | $27,870 | $5,428 | $22,442 |
| 2024 | $3,138 | $26,543 | $5,428 | $21,115 |
| 2023 | $3,138 | $25,279 | $5,428 | $19,851 |
| 2022 | $2,748 | $24,075 | $5,428 | $18,647 |
| 2021 | $2,705 | $24,075 | $5,428 | $18,647 |
| 2020 | $2,678 | $23,037 | $5,428 | $17,609 |
| 2019 | $2,736 | $23,241 | $5,428 | $17,813 |
| 2018 | $2,620 | $22,433 | $4,844 | $17,589 |
| 2017 | $2,512 | $21,365 | $4,072 | $17,293 |
| 2016 | $2,378 | $20,348 | $3,409 | $16,939 |
| 2014 | $2,103 | $18,456 | $1,819 | $16,637 |
| 2013 | -- | $19,175 | $1,200 | $17,975 |
Source: Public Records
Map
Nearby Homes
- 14550 S Pennsylvania Ave
- 0 W Waterloo Rd
- 10140 Oakwood Dr
- 13420 Saltgrass Dr
- 10260 Oakwood Dr
- 13400 Ridge Cir
- 13791 Scenic View Ln
- 13460 Blue Star St
- 13310 S Pennsylvania Ave
- 4648 Kensington Way
- 4150 W Waterloo Rd
- 5809 W Waterloo Rd
- 13157 Huntington Dr
- 13172 Mannington Rd
- 13156 Mannington Rd
- 14500 Meadow Ridge Ln
- 9801 Livingston Rd
- 9765 Livingston Rd
- 9881 Livingston Rd
- 13525 Creek View Dr
- 4826 Penn Place Dr
- 14350 S Pennsylvania Ave
- 4949 Penn Place Dr
- 4909 Penn Place Dr
- 5009 Penn Place Dr
- 4808 Penn Place Dr
- 14500 S Pennsylvania Ave
- 4841 Penn Place Dr
- 4801 Penn Place Dr
- 4790 Penn Place Dr
- 4797 Penn Place Dr
- 4772 Penn Place Dr Unit ONE
- 14550 S Pennsylvania Ave
- 14101 S Pennsylvania Ave
- 4777 Penn Place Dr
- 10014 Lacewood Dr
- 10028 Lacewood Dr
- 10029 Woodland Way
- 10029 Woodland Way
- 10043 Woodland Way