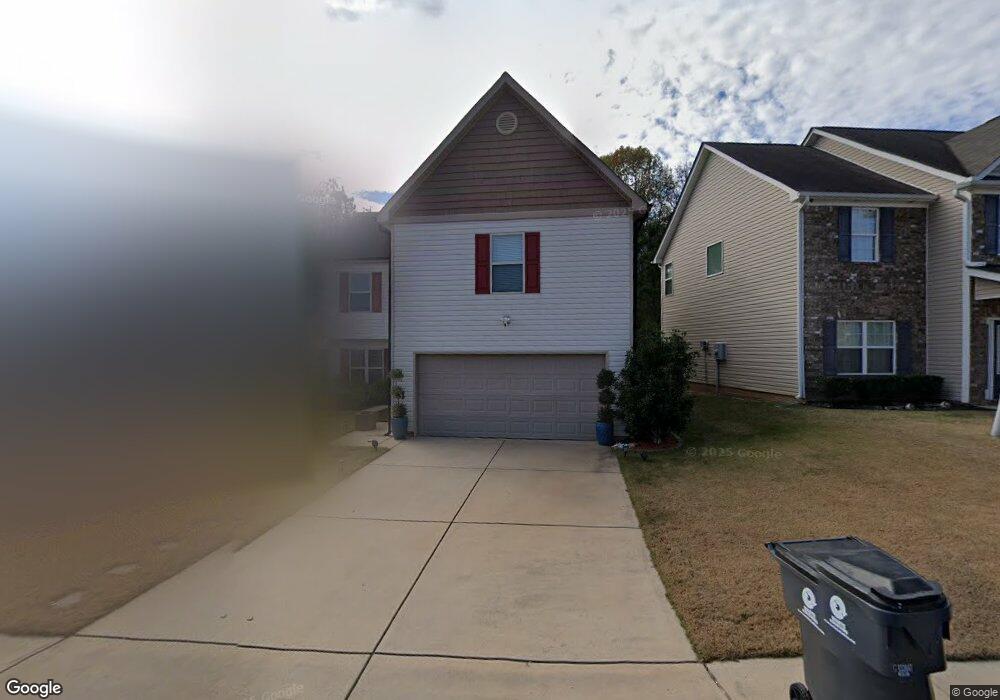
4914 Summersun Dr Morrow, GA 30260
Estimated Value: $283,923 - $391,000
5
Beds
4
Baths
2,176
Sq Ft
$151/Sq Ft
Est. Value
About This Home
This home is located at 4914 Summersun Dr, Morrow, GA 30260 and is currently estimated at $328,981, approximately $151 per square foot. 4914 Summersun Dr is a home located in Clayton County with nearby schools including Thurgood Marshall Elementary School, Morrow Middle School, and Morrow High School.
Ownership History
Date
Name
Owned For
Owner Type
Purchase Details
Closed on
Oct 22, 2018
Sold by
Boston Natasha
Bought by
Bolanos Miguel and Lanuza-Torres Alicia Sharet
Current Estimated Value
Home Financials for this Owner
Home Financials are based on the most recent Mortgage that was taken out on this home.
Original Mortgage
$160,050
Outstanding Balance
$139,300
Interest Rate
4.6%
Mortgage Type
New Conventional
Estimated Equity
$189,681
Purchase Details
Closed on
Dec 21, 2009
Sold by
Holder Homes Inc
Bought by
Boston Natasha
Home Financials for this Owner
Home Financials are based on the most recent Mortgage that was taken out on this home.
Original Mortgage
$122,637
Interest Rate
4.92%
Mortgage Type
FHA
Purchase Details
Closed on
Jul 29, 2009
Sold by
Park Avenue Bank
Bought by
Holder Homes Inc
Home Financials for this Owner
Home Financials are based on the most recent Mortgage that was taken out on this home.
Original Mortgage
$59,700
Interest Rate
5.36%
Create a Home Valuation Report for This Property
The Home Valuation Report is an in-depth analysis detailing your home's value as well as a comparison with similar homes in the area
Purchase History
| Date | Buyer | Sale Price | Title Company |
|---|---|---|---|
| Bolanos Miguel | $165,000 | -- | |
| Boston Natasha | $124,900 | -- | |
| Holder Homes Inc | $59,700 | -- |
Source: Public Records
Mortgage History
| Date | Status | Borrower | Loan Amount |
|---|---|---|---|
| Open | Bolanos Miguel | $160,050 | |
| Previous Owner | Boston Natasha | $122,637 | |
| Previous Owner | Holder Homes Inc | $59,700 |
Source: Public Records
Tax History
| Year | Tax Paid | Tax Assessment Tax Assessment Total Assessment is a certain percentage of the fair market value that is determined by local assessors to be the total taxable value of land and additions on the property. | Land | Improvement |
|---|---|---|---|---|
| 2025 | $3,719 | $106,120 | $8,800 | $97,320 |
| 2024 | $4,398 | $121,760 | $8,800 | $112,960 |
| 2023 | $4,442 | $123,040 | $8,800 | $114,240 |
| 2022 | $2,975 | $84,840 | $8,800 | $76,040 |
| 2021 | $2,719 | $77,880 | $8,800 | $69,080 |
| 2020 | $2,569 | $73,273 | $8,800 | $64,473 |
| 2019 | $2,311 | $66,000 | $5,600 | $60,400 |
| 2018 | $2,165 | $62,400 | $5,600 | $56,800 |
| 2017 | $2,068 | $59,896 | $5,600 | $54,296 |
| 2016 | $2,235 | $63,989 | $5,600 | $58,389 |
| 2015 | $1,561 | $0 | $0 | $0 |
| 2014 | $1,418 | $44,684 | $5,600 | $39,084 |
Source: Public Records
Map
Nearby Homes
- 1829 Joy Lake Rd
- 2105 Forest Pkwy
- 5420 Herndon Blvd
- 1639 Burks Dr
- 2183 Miranda Dr
- 2202 Miranda Dr
- 5372 Bryant Blvd
- 2207 Miranda Dr
- 5356 Creekview Way
- 0 Herndon Blvd Unit 7730551
- 0 Herndon Blvd Unit 7686770
- LOT 39 Herndon Blvd
- LOT 26,27,28 Herndon Blvd
- 3262 Anvil Block Rd
- 5651 Handley Blvd
- 5654 Waterford Ct
- 5521 Sapphire Cir
- 0 Poplar Ave Unit 10481115
- 0 Poplar Ave Unit 7543163
- 0 Denson Blvd Unit 1527338
- 4918 Summersun Dr
- 4910 Summersun Dr
- 4922 Summersun Dr
- 4906 Summersun Dr Unit 89
- 4906 Summersun Dr
- 4926 Summersun Dr
- 4902 Summersun Dr
- 4917 Summersun Dr
- 4909 Summersun Dr
- 4921 Summersun Dr
- 4905 Summersun Dr
- 4930 Summersun Dr
- 4925 Summersun Dr
- 4898 Summersun Dr
- 4929 Summersun Dr
- 4901 Summersun Dr
- 4934 Summersun Dr
- 5126 Summerview Way
- 4894 Summersun Dr
- 5121 Summerview Way
Your Personal Tour Guide
Ask me questions while you tour the home.