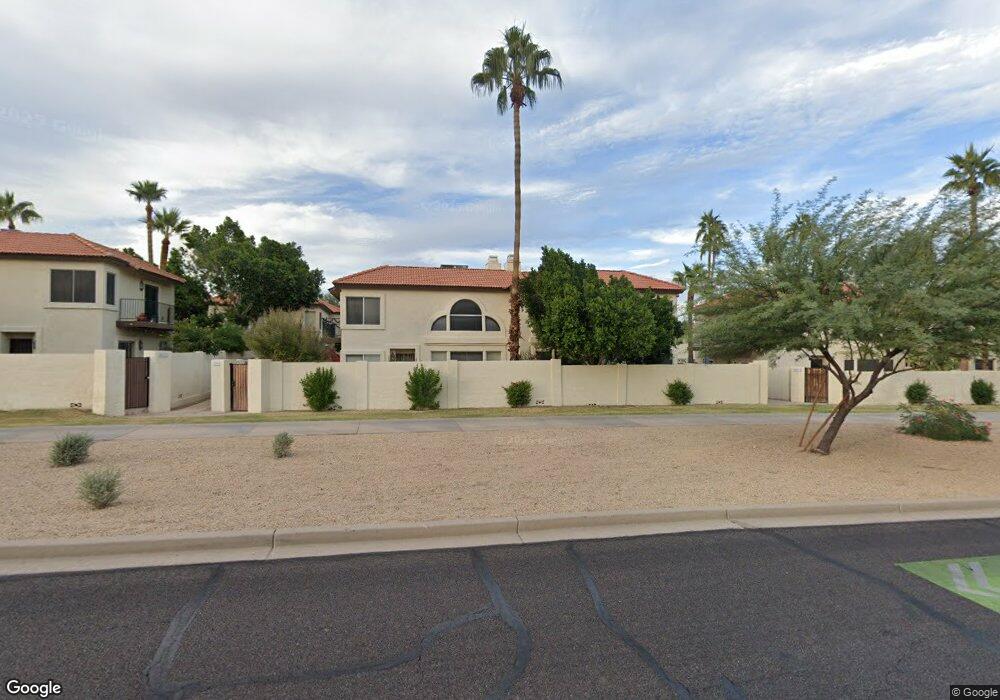
4919 E Hazel Dr Unit 1 Phoenix, AZ 85044
Ahwatukee NeighborhoodEstimated Value: $378,000 - $402,000
Studio
3
Baths
1,435
Sq Ft
$274/Sq Ft
Est. Value
About This Home
This home is located at 4919 E Hazel Dr Unit 1, Phoenix, AZ 85044 and is currently estimated at $392,953, approximately $273 per square foot. 4919 E Hazel Dr Unit 1 is a home located in Maricopa County with nearby schools including Frank Elementary School, Fees College Preparatory Middle School, and Mountain Pointe High School.
Ownership History
Date
Name
Owned For
Owner Type
Purchase Details
Closed on
May 5, 2003
Sold by
Sorensen Elsie
Bought by
Sorensen Kirsten Ann
Current Estimated Value
Home Financials for this Owner
Home Financials are based on the most recent Mortgage that was taken out on this home.
Original Mortgage
$129,209
Outstanding Balance
$55,829
Interest Rate
5.71%
Mortgage Type
New Conventional
Estimated Equity
$337,124
Purchase Details
Closed on
Nov 2, 1998
Sold by
Sorensen Elsie A and Sorensen Christine M
Bought by
Sorensen Elsie and Elsie Sorensen Declaration Of Trust
Purchase Details
Closed on
Dec 19, 1995
Sold by
Capistrano Residential Sales Llc
Bought by
Sorensen Elsie A and Sorensen Christine M
Create a Home Valuation Report for This Property
The Home Valuation Report is an in-depth analysis detailing your home's value as well as a comparison with similar homes in the area
Home Values in the Area
Average Home Value in this Area
Purchase History
| Date | Buyer | Sale Price | Title Company |
|---|---|---|---|
| Sorensen Kirsten Ann | $159,200 | Fidelity National Title | |
| Sorensen Elsie | -- | -- | |
| Sorensen Elsie A | $109,400 | Security Title | |
| Capistrano Residential Sales Llc | -- | Security Title Agency |
Source: Public Records
Mortgage History
| Date | Status | Borrower | Loan Amount |
|---|---|---|---|
| Open | Sorensen Kirsten Ann | $129,209 |
Source: Public Records
Tax History
| Year | Tax Paid | Tax Assessment Tax Assessment Total Assessment is a certain percentage of the fair market value that is determined by local assessors to be the total taxable value of land and additions on the property. | Land | Improvement |
|---|---|---|---|---|
| 2025 | $2,402 | $20,695 | -- | -- |
| 2024 | $2,233 | $19,710 | -- | -- |
| 2023 | $2,233 | $29,330 | $5,860 | $23,470 |
| 2022 | $2,150 | $22,820 | $4,560 | $18,260 |
| 2021 | $2,170 | $19,970 | $3,990 | $15,980 |
| 2020 | $2,102 | $18,400 | $3,680 | $14,720 |
| 2019 | $2,062 | $17,670 | $3,530 | $14,140 |
| 2018 | $2,010 | $17,270 | $3,450 | $13,820 |
| 2017 | $1,944 | $16,500 | $3,300 | $13,200 |
| 2016 | $1,929 | $16,250 | $3,250 | $13,000 |
| 2015 | $1,810 | $15,550 | $3,110 | $12,440 |
Source: Public Records
Map
Nearby Homes
- 4918 E Siesta Dr Unit 3
- 5002 E Hazel Dr Unit 2
- 8840 S 51st St Unit 1
- 8844 S 51st St Unit 2
- 5019 E Siesta Dr Unit 1
- 9211 S 47th Place
- 5002 E Siesta Dr Unit 1
- 8841 S 51st St Unit 1
- 4936 E Siesta Dr Unit 3
- 8849 S 48th St Unit 3
- 8826 S 51st St Unit 1
- 5018 E Siesta Dr Unit 3
- 5032 E Siesta Dr Unit 3
- 8818 S 51st St Unit 1
- 5036 E Siesta Dr Unit 1
- 8821 S 51st St Unit 2
- 8829 S 51st St Unit 3
- 8817 S 51st St Unit 1
- 4814 E Monte Way Unit 8
- 8805 S 51st St Unit 2
- 4919 E Hazel Dr Unit 3
- 4919 E Hazel Dr
- 4837 E Hazel Dr Unit 1
- 4837 E Hazel Dr Unit 2
- 4829 E Hazel Dr Unit 1
- 4829 E Hazel Dr Unit 2
- 50152 E Hazel Dr
- 800 E Hazel Dr Unit 24
- 4923 E Hazel Dr
- 4923 E Hazel Dr Unit 2
- 4923 E Hazel Dr Unit 1
- 4833R E Hazel Dr
- 4833 E Hazel Dr
- 4833 E Hazel Dr Unit 3
- 4833 E Hazel Dr Unit 2
- 4833 E Hazel Dr Unit 1
- 4818 E Hazel Dr Unit 3
- 4818 E Hazel Dr Unit 2
- 4902 E Hazel Dr Unit 2
- 4902 E Hazel Dr Unit 1
Your Personal Tour Guide
Ask me questions while you tour the home.