


492-2 W 900 S Hebron, IN 46341
Porter County NeighborhoodEstimated payment $623/month
Highlights
- 2.1 Acre Lot
- Wooded Lot
- Corner Lot
- Hebron Middle School Rated 9+
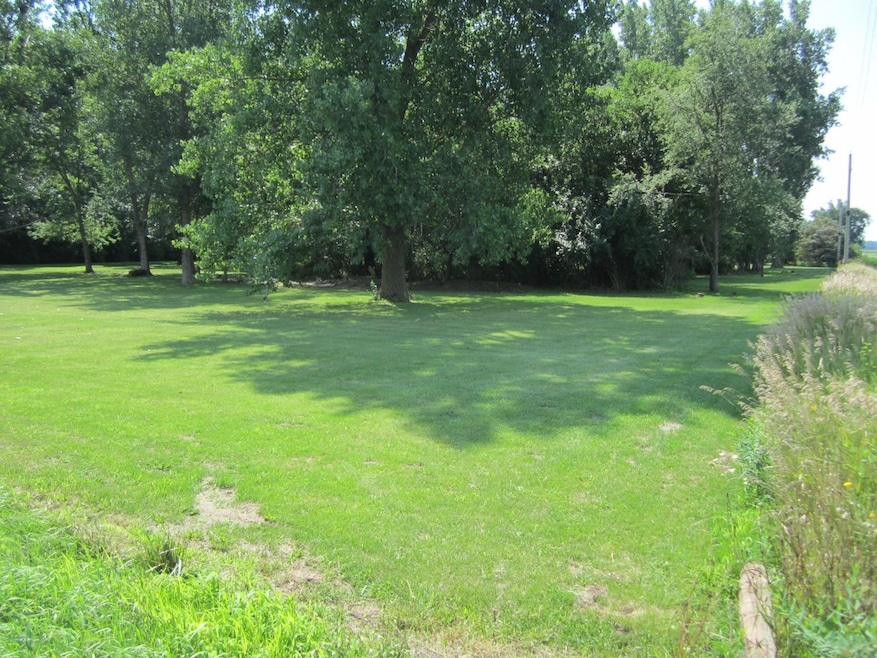
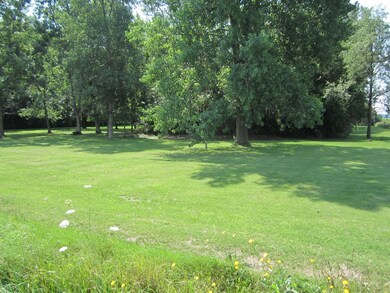
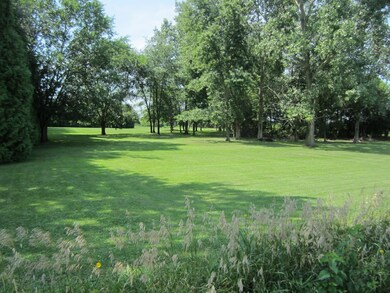
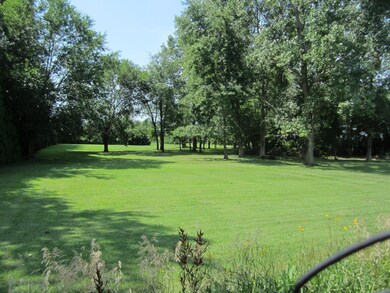
About This Lot
Looking for WOODED, CORNER Parcel? Take a look at this lovely lot located on the SE corner of900 South and 500 West. This is truly a great location, on blacktop roads and within 5 minutes ofdowntown Hebron and schools. Lot will need to be surveyed off existing 4.2 acre parcel but dimensions should be approximately 248' +/- on 900 South and 368' +/- on 500 West. TAX shown is for house plus 4.2 acres!
Property Details
Property Type
- Land
Est. Annual Taxes
- $1,145
Lot Details
- 2.1 Acre Lot
- Lot Dimensions are 243 x 368
- Corner Lot
- Wooded Lot
Utilities
- Well
Listing and Financial Details
- Assessor Parcel Number 641519101001000001
Map
Home Values in the Area
Average Home Value in this Area
Tax History
| Year | Tax Paid | Tax Assessment Tax Assessment Total Assessment is a certain percentage of the fair market value that is determined by local assessors to be the total taxable value of land and additions on the property. | Land | Improvement |
|---|---|---|---|---|
| 2024 | $1,145 | $212,300 | $64,700 | $147,600 |
| 2023 | $1,005 | $172,700 | $61,500 | $111,200 |
| 2022 | $1,008 | $168,600 | $61,500 | $107,100 |
| 2021 | $1,178 | $156,700 | $61,500 | $95,200 |
| 2020 | $1,155 | $147,900 | $58,400 | $89,500 |
| 2019 | $1,147 | $143,800 | $58,400 | $85,400 |
| 2018 | $1,471 | $133,700 | $58,400 | $75,300 |
| 2017 | $1,460 | $134,300 | $58,400 | $75,900 |
| 2016 | $1,532 | $140,800 | $64,700 | $76,100 |
| 2014 | $1,700 | $134,300 | $62,100 | $72,200 |
| 2013 | -- | $137,800 | $66,500 | $71,300 |
Property History
| Date | Event | Price | List to Sale | Price per Sq Ft |
|---|---|---|---|---|
| 04/01/2023 04/01/23 | Pending | -- | -- | -- |
| 01/03/2023 01/03/23 | For Sale | $100,000 | -- | -- |
Source: Northwest Indiana Association of REALTORS®
MLS Number: 524401
APN: 64-15-19-101-001.000-001
Disclaimer: Certain information contained herein is derived from information provided by parties other than Homes.com. All information provided is deemed reliable, but is not guaranteed to be accurate and should be independently verified.
![]() Copyright 2025 MuItiple Listing Service of the Northwest Indiana Realtors Association Multiple Listing Service (NIRA MLS). All rights reserved. IDX information is provided exclusively for personal, non-commercial use, and may not be used for any purpose other than to identify prospective properties consumers may be interested in purchasing. Information is deemed reliable but not guaranteed.
Copyright 2025 MuItiple Listing Service of the Northwest Indiana Realtors Association Multiple Listing Service (NIRA MLS). All rights reserved. IDX information is provided exclusively for personal, non-commercial use, and may not be used for any purpose other than to identify prospective properties consumers may be interested in purchasing. Information is deemed reliable but not guaranteed.
- 393 W 900 S
- 454 W 900 S
- 375 Reif Dr
- 853 S 400 W
- 559 W Corbly Rd
- 687 S 500 W
- 308 E Bates St
- 515 Tamarack Trail
- 202 N Lincoln St
- 409 S Jefferson St
- 6860 Ramsey Rd
- 606 N Main St
- 519 W 650 S
- 763 W 900 S
- 606 W Sigler St
- 21 Marvin Gardens Ave
- 96 Hickory Ave
- 709 Beverly Dr
- 1123 S State Road 231
- 521 Ryan Rd
