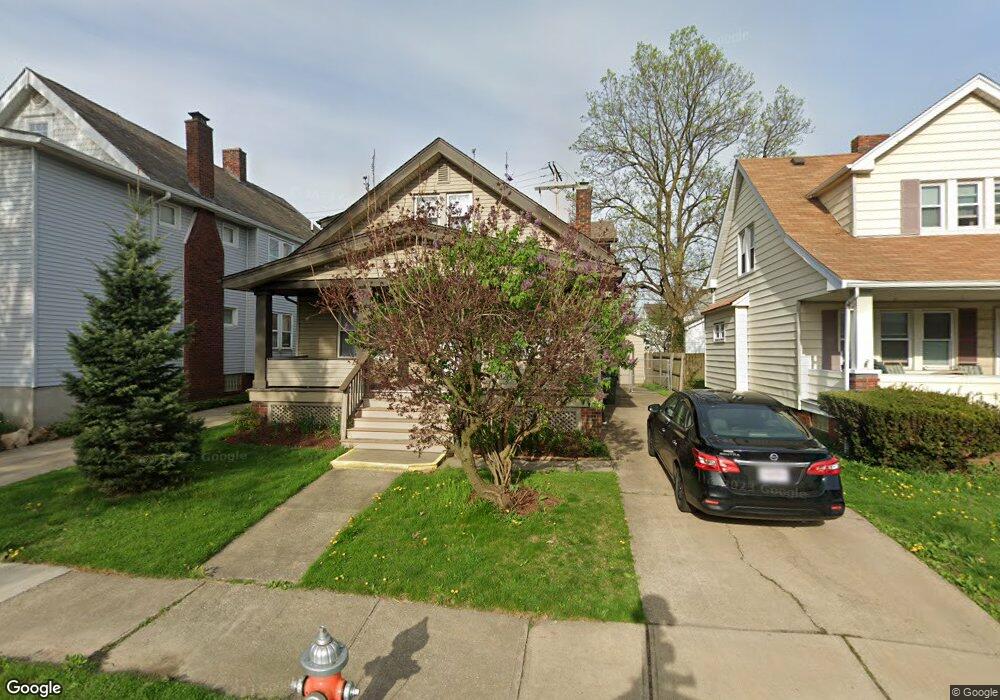
4920 E 106th St Cleveland, OH 44125
Estimated Value: $109,323 - $176,000
5
Beds
2
Baths
1,414
Sq Ft
$93/Sq Ft
Est. Value
About This Home
This home is located at 4920 E 106th St, Cleveland, OH 44125 and is currently estimated at $131,331, approximately $92 per square foot. 4920 E 106th St is a home located in Cuyahoga County with nearby schools including Garfield Heights High School, North Shore High School, and Trinity High School.
Ownership History
Date
Name
Owned For
Owner Type
Purchase Details
Closed on
Dec 30, 2013
Sold by
Roberts Roseann and Roberts Eugene D
Bought by
Roberts Alan J
Current Estimated Value
Purchase Details
Closed on
Feb 27, 2008
Sold by
Us Bank Na
Bought by
Roberts Roseann
Purchase Details
Closed on
May 11, 2007
Sold by
Seese Lloyd R and Seese Shirley A
Bought by
Us Bank National Assn
Purchase Details
Closed on
Oct 12, 1993
Sold by
Andel Jerome T and Andel Robin E
Bought by
Seese Lloyd R
Purchase Details
Closed on
Jul 25, 1985
Sold by
Flanik Michael J
Bought by
Andel Jerome T and Andel Robin E
Purchase Details
Closed on
Jan 14, 1982
Sold by
Kidd Michael L and Kidd Barbara
Bought by
Kidd Barbara M
Purchase Details
Closed on
Nov 5, 1975
Sold by
Hart Michael and Hart Catherine
Bought by
Kidd Michael L and Kidd Barbara
Purchase Details
Closed on
Jan 1, 1975
Bought by
Hart Michael and Hart Catherine
Create a Home Valuation Report for This Property
The Home Valuation Report is an in-depth analysis detailing your home's value as well as a comparison with similar homes in the area
Home Values in the Area
Average Home Value in this Area
Purchase History
| Date | Buyer | Sale Price | Title Company |
|---|---|---|---|
| Roberts Alan J | -- | None Available | |
| Roberts Roseann | $26,900 | Resource Title Agency Inc | |
| Us Bank National Assn | $50,000 | Attorney | |
| Seese Lloyd R | $64,000 | -- | |
| Andel Jerome T | -- | -- | |
| Kidd Barbara M | -- | -- | |
| Kidd Michael L | $18,300 | -- | |
| Hart Michael | -- | -- |
Source: Public Records
Tax History
| Year | Tax Paid | Tax Assessment Tax Assessment Total Assessment is a certain percentage of the fair market value that is determined by local assessors to be the total taxable value of land and additions on the property. | Land | Improvement |
|---|---|---|---|---|
| 2025 | $3,004 | $35,385 | $7,000 | $28,385 |
| 2024 | $3,732 | $35,385 | $7,000 | $28,385 |
| 2023 | $2,605 | $22,470 | $4,760 | $17,710 |
| 2022 | $2,566 | $22,470 | $4,760 | $17,710 |
| 2021 | $2,711 | $22,470 | $4,760 | $17,710 |
| 2020 | $2,338 | $17,990 | $3,820 | $14,180 |
| 2019 | $2,318 | $51,400 | $10,900 | $40,500 |
| 2018 | $2,264 | $17,990 | $3,820 | $14,180 |
| 2017 | $2,222 | $16,110 | $3,050 | $13,060 |
| 2016 | $2,253 | $16,110 | $3,050 | $13,060 |
| 2015 | -- | $16,110 | $3,050 | $13,060 |
| 2014 | -- | $19,640 | $3,710 | $15,930 |
Source: Public Records
Map
Nearby Homes
- 4940 E 106th St
- 4885 E 107th St
- 10606 Langton Ave
- 10609 Wadsworth Ave
- 4922 E 109th St
- 4902 E 109th St
- 4915 E 111th St
- 9717 Alexander Rd
- 10506 Park Heights Ave
- 10201 Greenview Ave
- 10925 Mccracken Rd
- 11206 Park Heights Ave
- 9516 Alexander Rd
- 9602 Plymouth Ave
- 4847 E 94th St
- 4839 E 94th St
- 11303 Mccracken Rd
- 4864 E 94th St
- 11011 Wallingford Ave
- 9722 Robinson Ave
- 4926 E 106th St
- 4916 E 106th St
- 4928 E 106th St
- 4912 E 106th St
- 10407 Summerdale Ave
- 10404 Homeworth Ave
- 10403 Summerdale Ave
- 10402 Homeworth Ave
- 4921 E 106th St
- 4917 E 106th St
- 4925 E 106th St
- 10312 Homeworth Ave
- 10313 Summerdale Ave
- 4911 E 106th St
- 4936 E 106th St
- 4929 E 106th St
- 4902 E 106th St
- 4909 E 106th St
- 10308 Homeworth Ave
- 10308 Homeworth Ave Unit 2nd Fl
Your Personal Tour Guide
Ask me questions while you tour the home.