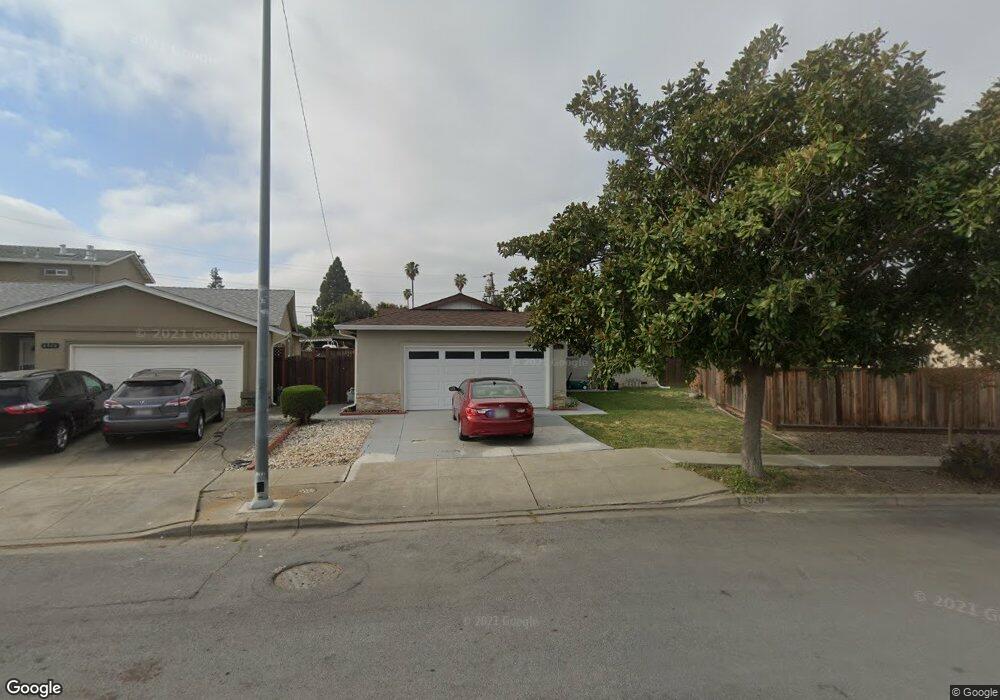
4920 Nelson St Fremont, CA 94538
Sundale NeighborhoodEstimated Value: $1,342,000 - $1,638,602
3
Beds
2
Baths
1,400
Sq Ft
$1,071/Sq Ft
Est. Value
About This Home
This home is located at 4920 Nelson St, Fremont, CA 94538 and is currently estimated at $1,499,651, approximately $1,071 per square foot. 4920 Nelson St is a home located in Alameda County with nearby schools including Joseph Azevada Elementary School, G.M. Walters Middle School, and John F. Kennedy High School.
Ownership History
Date
Name
Owned For
Owner Type
Purchase Details
Closed on
Feb 17, 2020
Sold by
Therdsteerasukdi Kanit and Therdsteerasukdi Hataipat
Bought by
Therdsteerasukdi Kanit and Therdsteerasukdi Hataipat S
Current Estimated Value
Home Financials for this Owner
Home Financials are based on the most recent Mortgage that was taken out on this home.
Original Mortgage
$685,000
Outstanding Balance
$595,649
Interest Rate
2.7%
Mortgage Type
New Conventional
Estimated Equity
$904,002
Purchase Details
Closed on
Jul 9, 2018
Sold by
United Investment Fund Inc
Bought by
Therdsteerasukdi Kanit and Therdsteerasukdi Hataipat
Home Financials for this Owner
Home Financials are based on the most recent Mortgage that was taken out on this home.
Original Mortgage
$912,000
Interest Rate
4.25%
Mortgage Type
Adjustable Rate Mortgage/ARM
Purchase Details
Closed on
Jan 26, 2018
Sold by
Depue Reta Mae and Scott Reta Mae
Bought by
United Investment Fund Inc
Home Financials for this Owner
Home Financials are based on the most recent Mortgage that was taken out on this home.
Original Mortgage
$807,840
Interest Rate
3.94%
Mortgage Type
Purchase Money Mortgage
Purchase Details
Closed on
Mar 17, 2006
Sold by
Scott Darrell J
Bought by
Depue Reta Mae and Scott Reta Mae
Create a Home Valuation Report for This Property
The Home Valuation Report is an in-depth analysis detailing your home's value as well as a comparison with similar homes in the area
Home Values in the Area
Average Home Value in this Area
Purchase History
| Date | Buyer | Sale Price | Title Company |
|---|---|---|---|
| Therdsteerasukdi Kanit | -- | Chicago Title Company | |
| Therdsteerasukdi Kanit | $1,140,000 | Old Republic Title Company | |
| United Investment Fund Inc | $990,000 | First American Title Company | |
| Depue Reta Mae | -- | None Available |
Source: Public Records
Mortgage History
| Date | Status | Borrower | Loan Amount |
|---|---|---|---|
| Open | Therdsteerasukdi Kanit | $685,000 | |
| Closed | Therdsteerasukdi Kanit | $912,000 | |
| Previous Owner | United Investment Fund Inc | $807,840 |
Source: Public Records
Tax History Compared to Growth
Tax History
| Year | Tax Paid | Tax Assessment Tax Assessment Total Assessment is a certain percentage of the fair market value that is determined by local assessors to be the total taxable value of land and additions on the property. | Land | Improvement |
|---|---|---|---|---|
| 2025 | $14,864 | $1,264,670 | $557,750 | $713,920 |
| 2024 | $14,864 | $1,239,738 | $546,815 | $699,923 |
| 2023 | $14,477 | $1,222,296 | $536,095 | $686,201 |
| 2022 | $14,305 | $1,191,333 | $525,585 | $672,748 |
| 2021 | $13,949 | $1,167,838 | $515,280 | $659,558 |
| 2020 | $14,041 | $1,162,800 | $510,000 | $652,800 |
| 2019 | $13,878 | $1,140,000 | $500,000 | $640,000 |
| 2018 | $1,489 | $82,358 | $15,027 | $67,331 |
| 2017 | $1,452 | $80,744 | $14,733 | $66,011 |
| 2016 | $1,411 | $79,161 | $14,444 | $64,717 |
| 2015 | $1,377 | $77,972 | $14,227 | $63,745 |
| 2014 | $1,342 | $76,444 | $13,948 | $62,496 |
Source: Public Records
Map
Nearby Homes
- 4692 Nelson St
- 5033 Blacksand Rd
- 4714 Serra Ave
- 5330 Coco Palm Dr
- 39530 Dorrington Ct
- 4737 Boone Dr
- 4600 Nelson St
- 5589 Roosevelt Place
- 5580 Hemlock Terrace
- 39090 Presidio Way Unit 237
- 4715 Mildred Dr
- 5624 Chestnut Common
- 4840 Piper St
- 40116 Crockett St
- 39753 Placer Way
- 38976 Primula Terrace
- 38984 Primula Terrace
- 39751 Bissy Common
- 40422 Landon Ave
- 4572 De Silva St
- 4914 Nelson St
- 4910 Folsum Way
- 4918 Folsum Way
- 4906 Nelson St
- 4897 Nelson St
- 4926 Folsum Way
- 4898 Nelson St
- 39538 Blacow Rd
- 4915 Nelson St
- 39512 Blacow Rd
- 39535 Yuba Ct
- 4934 Nelson St
- 4909 Folsum Way
- 4923 Nelson St
- 4890 Nelson St
- 4941 Coco Palm Dr
- 4959 Coco Palm Dr
- 39576 Blacow Rd
- 4917 Folsum Way
- 39551 Yuba Ct