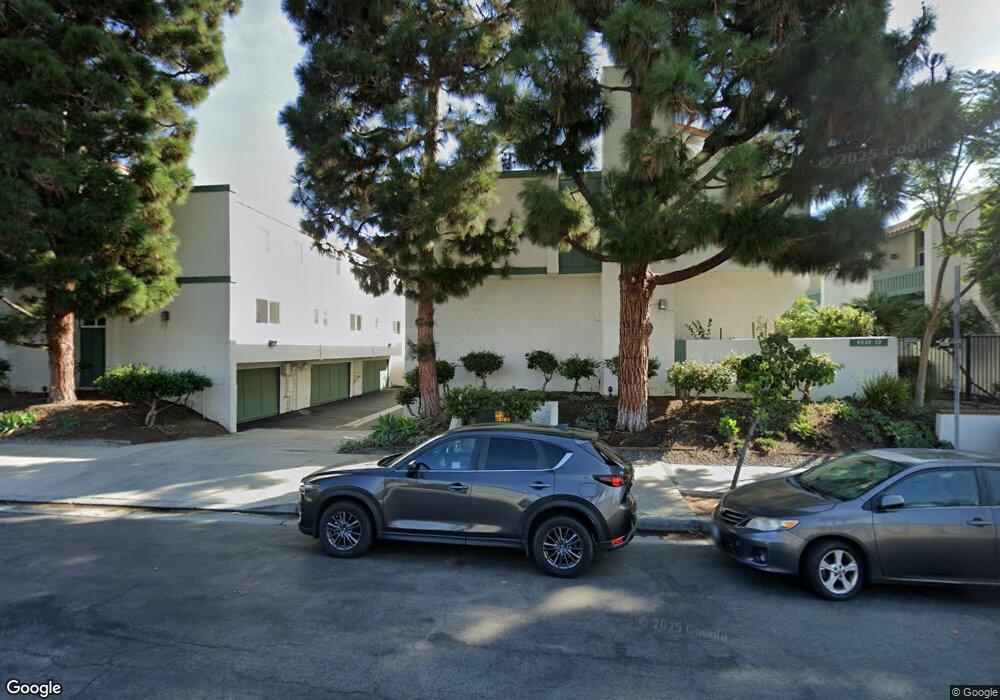
4922 Mcconnell Ave Unit 39 Los Angeles, CA 90066
Del Rey NeighborhoodEstimated Value: $1,174,000 - $1,256,000
3
Beds
3
Baths
1,858
Sq Ft
$653/Sq Ft
Est. Value
About This Home
This home is located at 4922 Mcconnell Ave Unit 39, Los Angeles, CA 90066 and is currently estimated at $1,213,956, approximately $653 per square foot. 4922 Mcconnell Ave Unit 39 is a home located in Los Angeles County with nearby schools including Braddock Drive Elementary School, Marina Del Rey Middle School, and Venice High School.
Ownership History
Date
Name
Owned For
Owner Type
Purchase Details
Closed on
Apr 6, 2000
Sold by
Clark Sara D
Bought by
Clark Sara and Sara Clark Trust
Current Estimated Value
Purchase Details
Closed on
Dec 1, 1997
Sold by
Clark Edgar D
Bought by
Clark Edgar D and Clark Sara D
Purchase Details
Closed on
Nov 1, 1993
Sold by
Clark Sara
Bought by
Clark Edgar D
Home Financials for this Owner
Home Financials are based on the most recent Mortgage that was taken out on this home.
Original Mortgage
$120,000
Interest Rate
6.91%
Purchase Details
Closed on
Oct 28, 1993
Sold by
Coast Federal Bank
Bought by
Clark Edgar D
Home Financials for this Owner
Home Financials are based on the most recent Mortgage that was taken out on this home.
Original Mortgage
$120,000
Interest Rate
6.91%
Create a Home Valuation Report for This Property
The Home Valuation Report is an in-depth analysis detailing your home's value as well as a comparison with similar homes in the area
Home Values in the Area
Average Home Value in this Area
Purchase History
| Date | Buyer | Sale Price | Title Company |
|---|---|---|---|
| Clark Sara | -- | -- | |
| Clark Edgar D | -- | -- | |
| Clark Edgar D | -- | Stewart Title | |
| Clark Edgar D | $215,000 | Stewart Title |
Source: Public Records
Mortgage History
| Date | Status | Borrower | Loan Amount |
|---|---|---|---|
| Previous Owner | Clark Edgar D | $120,000 |
Source: Public Records
Tax History Compared to Growth
Tax History
| Year | Tax Paid | Tax Assessment Tax Assessment Total Assessment is a certain percentage of the fair market value that is determined by local assessors to be the total taxable value of land and additions on the property. | Land | Improvement |
|---|---|---|---|---|
| 2025 | $4,543 | $374,575 | $150,063 | $224,512 |
| 2024 | $4,543 | $367,231 | $147,121 | $220,110 |
| 2023 | $4,459 | $360,032 | $144,237 | $215,795 |
| 2022 | $4,256 | $352,973 | $141,409 | $211,564 |
| 2021 | $4,197 | $346,053 | $138,637 | $207,416 |
| 2019 | $4,071 | $335,791 | $134,526 | $201,265 |
| 2018 | $4,036 | $329,208 | $131,889 | $197,319 |
| 2016 | $3,850 | $316,425 | $126,768 | $189,657 |
| 2015 | $3,794 | $311,673 | $124,864 | $186,809 |
| 2014 | $3,812 | $305,569 | $122,419 | $183,150 |
Source: Public Records
Map
Nearby Homes
- 12871 Rubens Ave
- 12850 Admiral Ave
- 12531 Culver Blvd
- 12961 Panama St
- 12537 Rubens Ave
- 12616 Bonaparte Ave
- 12837 Bonaparte Ave
- 12926 Bonaparte Ave
- 12437 Verdi St
- 12870 Walsh Ave
- 12479 Walsh Ave
- 4626 Alla Rd
- 4912 S Centinela Ave
- 4962 S Centinela Ave
- 4964 S Centinela Ave
- 4978 S Centinela Ave
- 12520 Gilmore Ave
- 12534 Gilmore Ave
- 12836 Gilmore Ave
- 12445 Greene Ave
- 4922 1/2 Mcconnell Ave
- 12723 Milton St
- 12727 Milton St
- 12733 Milton St
- 4928 Mcconnell Ave
- 4916 1/2 Mcconnell Ave Unit 44
- 4910 Mcconnell Ave
- 4916 Mcconnell Ave
- 4910 1/4 Mcconnell Ave
- 4910 1/2 Mcconnell Ave
- 4918 Mcconnell Ave
- 4918 1/2 Mcconnell Ave
- 4914 Mcconnell Ave Unit 1/2
- 4914 Mcconnell Ave Unit 47
- 4914 1/2 Mcconnell Ave
- 4926 1/2 Mcconnell Ave
- 4926 Mcconnell Ave Unit 1/2
- 4924 Mcconnell Ave
- 4924 Mcconnell Ave
- 4930 Mcconnell Ave