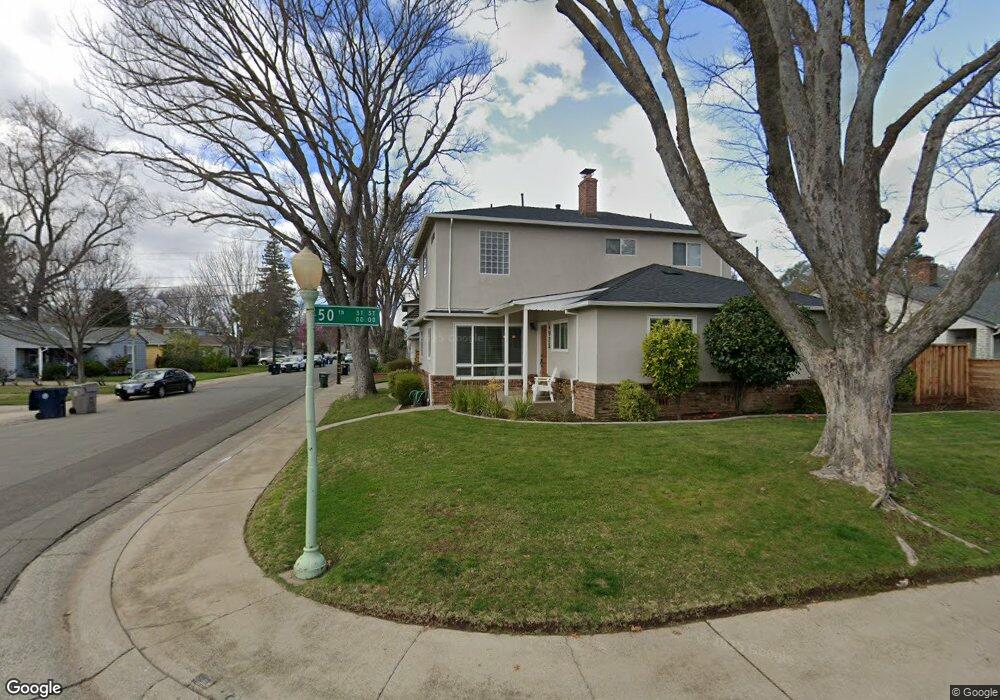
4925 Reid Way Sacramento, CA 95819
East Sacramento NeighborhoodEstimated Value: $418,000 - $916,000
4
Beds
3
Baths
2,079
Sq Ft
$351/Sq Ft
Est. Value
About This Home
This home is located at 4925 Reid Way, Sacramento, CA 95819 and is currently estimated at $728,969, approximately $350 per square foot. 4925 Reid Way is a home located in Sacramento County with nearby schools including Theodore Judah Elementary, Miwok Middle School, and Hiram W. Johnson High School.
Ownership History
Date
Name
Owned For
Owner Type
Purchase Details
Closed on
Jan 22, 2014
Sold by
Clara E Tafoya Truste
Bought by
Tafoya Clara E and Frank Tafoya Survivors Trust
Current Estimated Value
Purchase Details
Closed on
Aug 29, 2012
Sold by
Tafoya Clara E M and Tafoya Frank M
Bought by
Tafoya Clara E and The Clara Tafoya Survivors Tru
Purchase Details
Closed on
Dec 11, 1996
Sold by
Tafoya Frank M and Tafoya Clara E
Bought by
Tafoya Tina
Purchase Details
Closed on
May 8, 1995
Sold by
Tafoya Frank M and Tafoya Clara E
Bought by
Tafoya Tina
Purchase Details
Closed on
Dec 29, 1994
Sold by
Tafoya Frank M and Tafoya Clara E
Bought by
Tafoya Tina
Create a Home Valuation Report for This Property
The Home Valuation Report is an in-depth analysis detailing your home's value as well as a comparison with similar homes in the area
Home Values in the Area
Average Home Value in this Area
Purchase History
| Date | Buyer | Sale Price | Title Company |
|---|---|---|---|
| Tafoya Clara E | -- | None Available | |
| Tafoya Clara E | -- | None Available | |
| Tafoya Tina | -- | -- | |
| Tafoya Frank M | -- | -- | |
| Tafoya Tina | -- | -- | |
| Tafoya Frank M | -- | -- | |
| Tafoya Tina | -- | -- | |
| Tafoya Frank M | -- | -- |
Source: Public Records
Tax History Compared to Growth
Tax History
| Year | Tax Paid | Tax Assessment Tax Assessment Total Assessment is a certain percentage of the fair market value that is determined by local assessors to be the total taxable value of land and additions on the property. | Land | Improvement |
|---|---|---|---|---|
| 2025 | $4,057 | $336,194 | $104,006 | $232,188 |
| 2024 | $4,057 | $329,603 | $101,967 | $227,636 |
| 2023 | $3,961 | $323,141 | $99,968 | $223,173 |
| 2022 | $3,893 | $316,806 | $98,008 | $218,798 |
| 2021 | $3,712 | $310,595 | $96,087 | $214,508 |
| 2020 | $3,739 | $307,411 | $95,102 | $212,309 |
| 2019 | $3,659 | $301,385 | $93,238 | $208,147 |
| 2018 | $3,564 | $295,476 | $91,410 | $204,066 |
| 2017 | $3,515 | $289,683 | $89,618 | $200,065 |
| 2016 | $3,409 | $284,004 | $87,861 | $196,143 |
| 2015 | $3,325 | $279,739 | $86,542 | $193,197 |
| 2014 | $3,235 | $274,260 | $84,847 | $189,413 |
Source: Public Records
Map
Nearby Homes