Estimated Value: $176,000 - $183,000
3
Beds
2
Baths
1,366
Sq Ft
$131/Sq Ft
Est. Value
About This Home
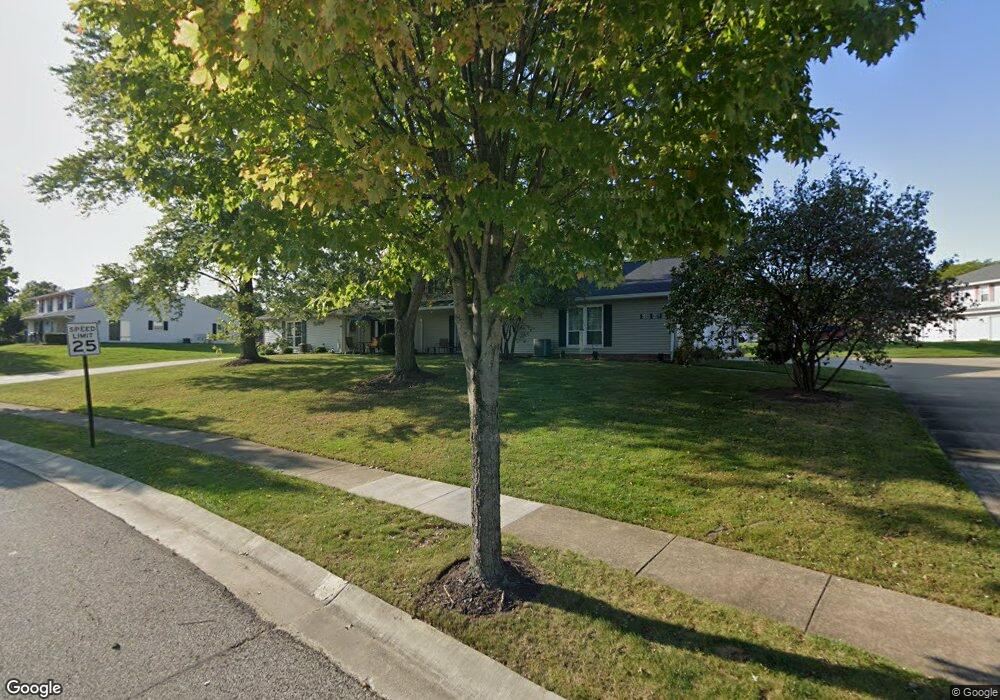
This home is located at 4926 Independence Cir Unit 29B, Stow, OH 44224 and is currently estimated at $179,208, approximately $131 per square foot. 4926 Independence Cir Unit 29B is a home located in Summit County with nearby schools including Stow-Munroe Falls High School, Primrose School of Hudson, and Holy Family Elementary School.
Ownership History
Date
Name
Owned For
Owner Type
Purchase Details
Closed on
Nov 19, 2024
Sold by
Horning Robert C and Hyde-Horning Ellen
Bought by
Ulinskas Karolina
Current Estimated Value
Purchase Details
Closed on
Jun 4, 2012
Sold by
Kaplan Philip C and Kozak Sarah
Bought by
Horning Ii Robert C and Hyde Horning Ellen
Home Financials for this Owner
Home Financials are based on the most recent Mortgage that was taken out on this home.
Original Mortgage
$58,500
Interest Rate
3.9%
Mortgage Type
New Conventional
Purchase Details
Closed on
Sep 29, 2005
Sold by
Roberts B Earle and Roberts Kathleen L
Bought by
Kaplan Philip C and Kozak Sarah
Home Financials for this Owner
Home Financials are based on the most recent Mortgage that was taken out on this home.
Original Mortgage
$70,000
Interest Rate
5.88%
Mortgage Type
Fannie Mae Freddie Mac
Create a Home Valuation Report for This Property
The Home Valuation Report is an in-depth analysis detailing your home's value as well as a comparison with similar homes in the area
Home Values in the Area
Average Home Value in this Area
Purchase History
| Date | Buyer | Sale Price | Title Company |
|---|---|---|---|
| Ulinskas Karolina | $159,000 | None Listed On Document | |
| Ulinskas Karolina | $159,000 | None Listed On Document | |
| Horning Ii Robert C | $65,000 | Attorney | |
| Kaplan Philip C | $90,000 | Miller Examining Service Inc |
Source: Public Records
Mortgage History
| Date | Status | Borrower | Loan Amount |
|---|---|---|---|
| Previous Owner | Horning Ii Robert C | $58,500 | |
| Previous Owner | Kaplan Philip C | $70,000 |
Source: Public Records
Tax History
| Year | Tax Paid | Tax Assessment Tax Assessment Total Assessment is a certain percentage of the fair market value that is determined by local assessors to be the total taxable value of land and additions on the property. | Land | Improvement |
|---|---|---|---|---|
| 2025 | $4,157 | $50,166 | $5,075 | $45,091 |
| 2024 | $2,855 | $50,166 | $5,075 | $45,091 |
| 2023 | $4,157 | $50,166 | $5,075 | $45,091 |
| 2021 | $1,809 | $36,621 | $3,707 | $32,914 |
| 2020 | $2,088 | $36,620 | $3,710 | $32,910 |
| 2019 | $1,663 | $27,060 | $3,670 | $23,390 |
| 2018 | $1,636 | $27,060 | $3,610 | $23,450 |
| 2017 | $1,495 | $27,060 | $3,610 | $23,450 |
| 2016 | $1,538 | $23,950 | $3,610 | $20,340 |
| 2015 | $1,495 | $23,950 | $3,610 | $20,340 |
| 2014 | $1,496 | $23,950 | $3,610 | $20,340 |
| 2013 | $1,527 | $24,620 | $3,610 | $21,010 |
Source: Public Records
Map
Nearby Homes
- 4932 Friar Rd Unit A
- 4916 Friar Rd Unit B
- 4638 Dresher Trail
- 4909 Fishcreek Rd
- 4399-4403 Cherryhurst Dr
- 4846 Garnet Cir
- 2221 Crockett Cir
- 4556 Fishcreek Rd
- 2188 Duxbury
- 2908 Wexford Blvd
- 2279 Becket Cir
- 4424 Timberdale Dr Unit 4428
- 4155 Burton Dr
- 5361 Diana Lynn Dr
- 2260 E Gilwood Dr
- 5131 Bayside Lake Blvd
- 4630 Red Willow Rd
- 5114 Bayside Lake Blvd
- 4138 Genevieve Blvd
- 4623 Cox Dr
- 4926 Independence Cir
- 4926 Independence Cir Unit 29A
- 4926 Independence Cir Unit 29D
- 4926 Independence Cir Unit B
- 4926 Independence Cir Unit D
- 4926 Independence Cir Unit A
- 4922 Independence Cir Unit B
- 4922 Independence Cir
- 4922 Independence Cir
- 4922 Independence Cir
- 4922 Independence Cir Unit 30C
- 4922 Independence Cir Unit D
- 4922 Independence Cir Unit C
- 4931 Friar Rd
- 4931 Friar Rd Unit 28A
- 4931 Friar Rd
- 4931 Friar Rd
- 4931 Friar Rd Unit B
- 4931 Friar Rd Unit c
- 4927 Friar Rd Unit 27A