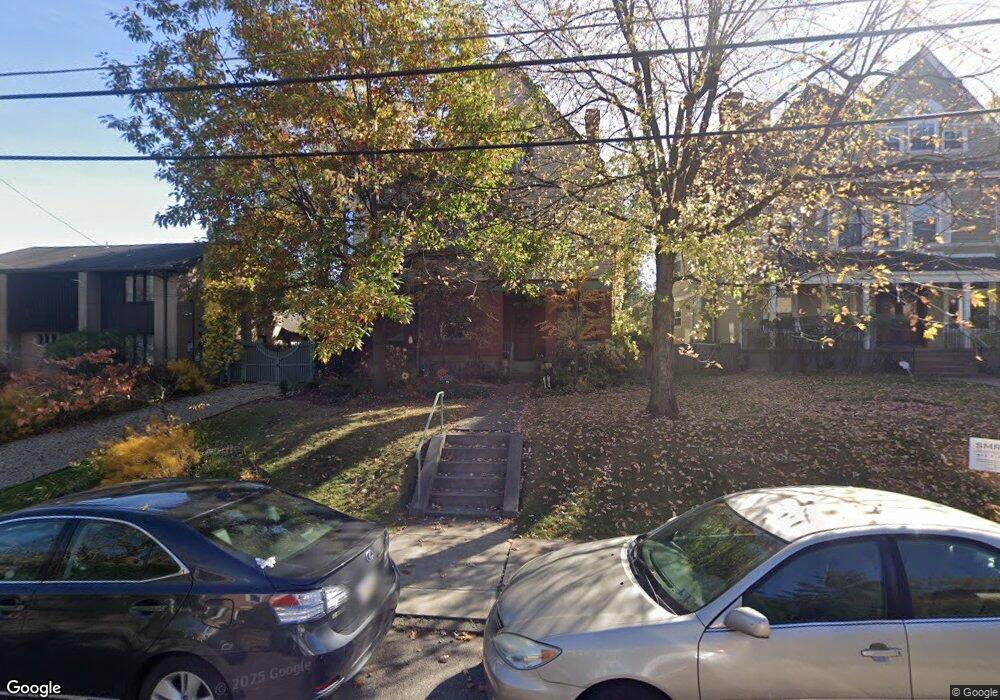
4926 Wallingford St Pittsburgh, PA 15213
Estimated Value: $1,096,000 - $1,708,000
6
Beds
4
Baths
4,579
Sq Ft
$290/Sq Ft
Est. Value
About This Home
This home is located at 4926 Wallingford St, Pittsburgh, PA 15213 and is currently estimated at $1,328,709, approximately $290 per square foot. 4926 Wallingford St is a home located in Allegheny County with nearby schools including Colfax K-8, Pittsburgh Allderdice High School, and Winchester Thurston School.
Ownership History
Date
Name
Owned For
Owner Type
Purchase Details
Closed on
Mar 31, 2009
Sold by
Schroeder J Howison
Bought by
Serafini Kevin G
Current Estimated Value
Home Financials for this Owner
Home Financials are based on the most recent Mortgage that was taken out on this home.
Original Mortgage
$408,700
Outstanding Balance
$258,364
Interest Rate
4.94%
Mortgage Type
New Conventional
Estimated Equity
$1,070,345
Purchase Details
Closed on
Oct 29, 1998
Sold by
Beaman Mary Inez and Cunningham James V
Bought by
Schroeder Schroeder J and Schroeder Elisabeth M
Purchase Details
Closed on
Jan 1, 1900
Create a Home Valuation Report for This Property
The Home Valuation Report is an in-depth analysis detailing your home's value as well as a comparison with similar homes in the area
Home Values in the Area
Average Home Value in this Area
Purchase History
| Date | Buyer | Sale Price | Title Company |
|---|---|---|---|
| Serafini Kevin G | $545,000 | -- | |
| Schroeder Schroeder J | $100,000 | -- | |
| -- | -- | -- |
Source: Public Records
Mortgage History
| Date | Status | Borrower | Loan Amount |
|---|---|---|---|
| Open | Serafini Kevin G | $408,700 |
Source: Public Records
Tax History Compared to Growth
Tax History
| Year | Tax Paid | Tax Assessment Tax Assessment Total Assessment is a certain percentage of the fair market value that is determined by local assessors to be the total taxable value of land and additions on the property. | Land | Improvement |
|---|---|---|---|---|
| 2025 | $11,695 | $507,600 | $183,000 | $324,600 |
| 2024 | $11,695 | $507,600 | $183,000 | $324,600 |
| 2023 | $11,695 | $507,600 | $183,000 | $324,600 |
| 2022 | $11,543 | $507,600 | $183,000 | $324,600 |
| 2021 | $11,573 | $507,600 | $183,000 | $324,600 |
| 2020 | $11,487 | $507,600 | $183,000 | $324,600 |
| 2019 | $11,487 | $507,600 | $183,000 | $324,600 |
| 2018 | $9,120 | $507,600 | $183,000 | $324,600 |
| 2017 | $11,487 | $507,600 | $183,000 | $324,600 |
| 2016 | $2,401 | $507,600 | $183,000 | $324,600 |
| 2015 | $2,401 | $507,600 | $183,000 | $324,600 |
| 2014 | $11,233 | $507,600 | $183,000 | $324,600 |
Source: Public Records
Map
Nearby Homes
- 405 Morewood Ave
- 4749 Wallingford St
- 4737 Bayard St
- 5 Bayard Rd Unit 714
- 5 Bayard Rd Unit 416
- 5 Bayard Rd Unit 309
- 5 Bayard Rd Unit 912
- 5 Bayard Rd Unit 500
- 5 Bayard Rd Unit 102
- 5 Bayard Rd Unit 808
- 5 Bayard Rd Unit 913
- 5 Bayard Rd Unit 907
- 5 Bayard Rd Unit 219
- 4719 Bayard St
- 4715 Bayard St
- 425 N Neville St Unit 204
- 5121 Bayard St
- 5154 Cypress St
- 537 N Neville St Unit 2F
- 159 Morewood Ave
- 4924 Wallingford St
- 4936 Wallingford St
- 4922 Wallingford St
- 420 Morewood Ave
- 410 Morewood Ave
- 4916 Wallingford St
- 406 Morewood Ave
- 416 Morewood Ave
- 427 Coventry Rd
- 412 Morewood Ave
- 400 Morewood Ave
- 426 Morewood Ave
- 422 Morewood Ave
- 424 Morewood Ave
- 4941 Wallingford St
- 433 Coventry Rd
- 4923 Wallingford St
- 426 Coventry Rd
- 432 Morewood Ave
- 4947 Wallingford St