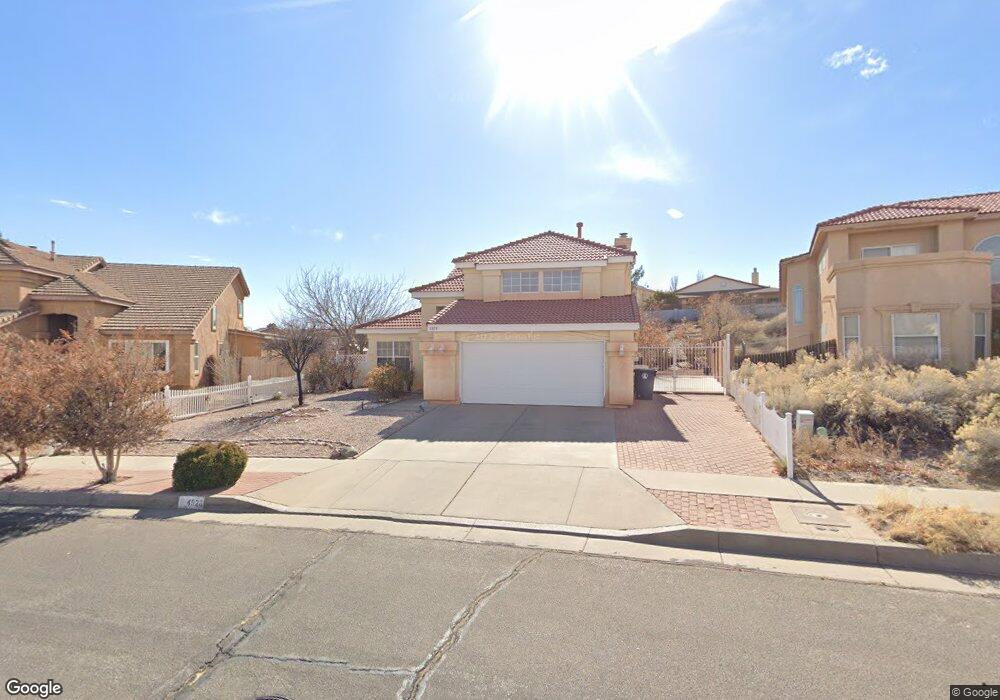
4928 Wellsburg Ave NW Albuquerque, NM 87120
Taylor Ranch NeighborhoodEstimated Value: $377,000 - $415,310
3
Beds
3
Baths
1,790
Sq Ft
$218/Sq Ft
Est. Value
About This Home
This home is located at 4928 Wellsburg Ave NW, Albuquerque, NM 87120 and is currently estimated at $389,578, approximately $217 per square foot. 4928 Wellsburg Ave NW is a home located in Bernalillo County with nearby schools including Chamiza Elementary School, L.B. Johnson Middle School, and Volcano Vista High School.
Ownership History
Date
Name
Owned For
Owner Type
Purchase Details
Closed on
Sep 13, 2016
Sold by
Moudelle Rodriguez Eufemia
Bought by
Moudelle Rodriguez Eufemia and Eufemia Moudelle Rodriguez Revocable Tsu
Current Estimated Value
Home Financials for this Owner
Home Financials are based on the most recent Mortgage that was taken out on this home.
Original Mortgage
$87,000
Outstanding Balance
$69,349
Interest Rate
3.45%
Mortgage Type
New Conventional
Estimated Equity
$320,229
Purchase Details
Closed on
Aug 9, 2006
Sold by
Rodriguez Eufemia M
Bought by
Moudelle Rodriguez Eufemia and Eufemia Moudelle Rodriguez Revocable Tr
Purchase Details
Closed on
Aug 26, 2003
Sold by
Sosa Thomas R and Sosa Isabela
Bought by
Zak Martin G and Zak Bernadette C
Home Financials for this Owner
Home Financials are based on the most recent Mortgage that was taken out on this home.
Original Mortgage
$145,350
Interest Rate
5.87%
Mortgage Type
Purchase Money Mortgage
Create a Home Valuation Report for This Property
The Home Valuation Report is an in-depth analysis detailing your home's value as well as a comparison with similar homes in the area
Home Values in the Area
Average Home Value in this Area
Purchase History
| Date | Buyer | Sale Price | Title Company |
|---|---|---|---|
| Moudelle Rodriguez Eufemia | -- | None Available | |
| Moudelle Rodriguez Eufemia | -- | None Available | |
| Moudelle Rodriguez Eufemia | -- | None Available | |
| Zak Martin G | -- | First American Title Ins Co |
Source: Public Records
Mortgage History
| Date | Status | Borrower | Loan Amount |
|---|---|---|---|
| Open | Moudelle Rodriguez Eufemia | $87,000 | |
| Closed | Zak Martin G | $145,350 |
Source: Public Records
Tax History Compared to Growth
Tax History
| Year | Tax Paid | Tax Assessment Tax Assessment Total Assessment is a certain percentage of the fair market value that is determined by local assessors to be the total taxable value of land and additions on the property. | Land | Improvement |
|---|---|---|---|---|
| 2025 | $3,446 | $86,179 | $28,935 | $57,244 |
| 2024 | $3,446 | $83,668 | $28,092 | $55,576 |
| 2023 | $3,386 | $81,232 | $27,274 | $53,958 |
| 2022 | $3,269 | $78,866 | $26,480 | $52,386 |
| 2021 | $3,157 | $76,570 | $25,709 | $50,861 |
| 2020 | $3,103 | $74,340 | $24,960 | $49,380 |
| 2019 | $3,009 | $72,175 | $24,233 | $47,942 |
| 2018 | $2,900 | $72,175 | $24,233 | $47,942 |
| 2017 | $2,893 | $70,073 | $23,528 | $46,545 |
| 2016 | $2,810 | $66,051 | $22,177 | $43,874 |
| 2015 | $64,127 | $64,127 | $21,531 | $42,596 |
| 2014 | $2,733 | $64,364 | $17,333 | $47,031 |
| 2013 | -- | $62,489 | $16,828 | $45,661 |
Source: Public Records
Map
Nearby Homes
- 4820 Summersville Dr NW
- 7939 Independence Dr NW
- 4515 Millwood Ct NW
- 4600 Waynesboro Place NW
- 7557 Richmond Hill Rd NW
- 7824 Snowberry St NW
- 4512 Waynesboro Rd NW
- 7532 Deerfield Rd NW
- 7809 Juneberry St NW
- 5333 Roanoke Ave NW
- 7516 Wells Fargo Trail NW
- 0 Calle Nortena North W
- 5136 Roanoke Ave NW
- 7739 Ridgeview Dr NW
- 7708 Ridgeview Dr NW
- 7432 Primrose Dr NW
- 4612 Lobelia Rd NW
- 4309 Rancho Largo Rd NW
- 4500 Samara Rd NW
- 4320 La Paloma Rd NW
- 4932 Wellsburg Ave NW
- 4924 Wellsburg Ave NW
- 8101 Waverly Dr NW
- 4921 Wellsburg Ave NW
- 8108 Fairmont Dr NW
- 8112 Fairmont Dr NW
- 8105 Waverly Dr NW
- 8104 Fairmont Dr NW
- 8100 Waverly Dr NW
- 4916 Wellsburg Ave NW
- 8116 Fairmont Dr NW
- 8100 Fairmont Dr NW
- 8104 Waverly Dr NW
- 4912 Wellsburg Ave NW
- 8120 Fairmont Dr NW
- 5025 Summersville Dr NW
- 8109 Waverly Dr NW
- 5021 Summersville Dr NW
- 8108 Waverly Dr NW
- 8124 Fairmont Dr NW