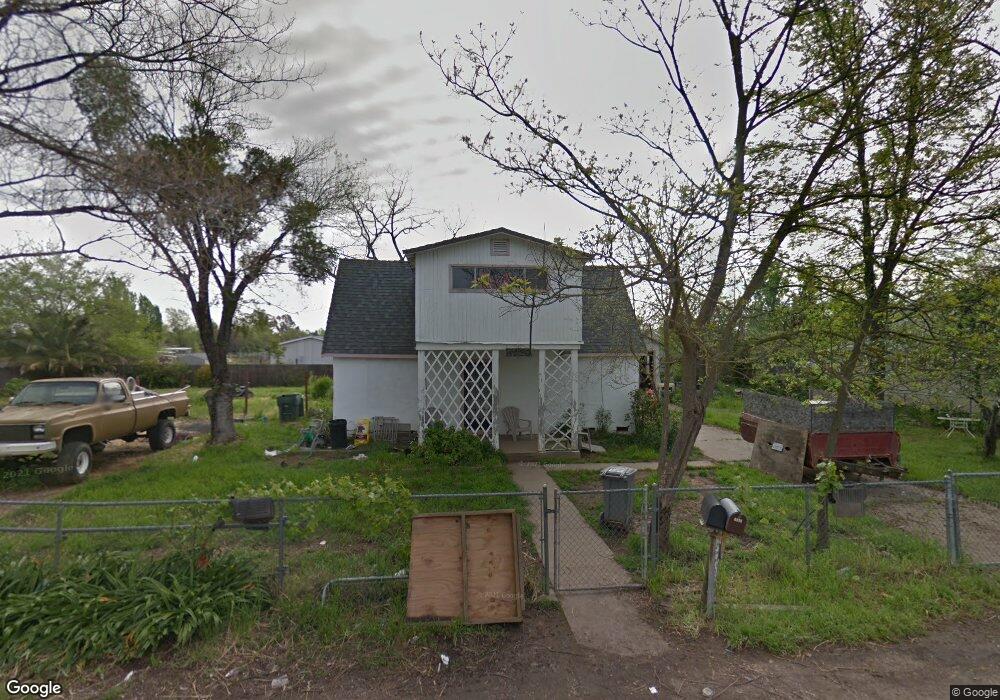
4929 Okmulgee Ave Olivehurst, CA 95961
Estimated Value: $330,000 - $389,000
2
Beds
1
Bath
1,826
Sq Ft
$195/Sq Ft
Est. Value
About This Home
This home is located at 4929 Okmulgee Ave, Olivehurst, CA 95961 and is currently estimated at $356,594, approximately $195 per square foot. 4929 Okmulgee Ave is a home located in Yuba County with nearby schools including Ella Elementary School, Yuba Gardens Intermediate School, and Lindhurst High School.
Ownership History
Date
Name
Owned For
Owner Type
Purchase Details
Closed on
Dec 2, 2020
Sold by
Center Jennifer
Bought by
Center Logan
Current Estimated Value
Home Financials for this Owner
Home Financials are based on the most recent Mortgage that was taken out on this home.
Original Mortgage
$156,000
Outstanding Balance
$139,134
Interest Rate
2.8%
Mortgage Type
New Conventional
Estimated Equity
$217,460
Purchase Details
Closed on
Jun 5, 2015
Sold by
Center Roy
Bought by
Center Logan
Home Financials for this Owner
Home Financials are based on the most recent Mortgage that was taken out on this home.
Original Mortgage
$127,136
Interest Rate
4.25%
Mortgage Type
FHA
Purchase Details
Closed on
Mar 25, 2011
Sold by
Sue Christy
Bought by
Center Roy
Purchase Details
Closed on
Feb 11, 2011
Sold by
Sue Christy
Bought by
Sue Christy and Roy Center Trust
Purchase Details
Closed on
Dec 13, 2004
Sold by
Hotman Bernice P
Bought by
Hake Marilyn and Horizon Resource & Care Management Inc
Purchase Details
Closed on
Mar 21, 2003
Sold by
Phillips Lillie M
Bought by
Phillips Lillie M and Hotman Bernice
Create a Home Valuation Report for This Property
The Home Valuation Report is an in-depth analysis detailing your home's value as well as a comparison with similar homes in the area
Home Values in the Area
Average Home Value in this Area
Purchase History
| Date | Buyer | Sale Price | Title Company |
|---|---|---|---|
| Center Logan | -- | Placer Title Company | |
| Center Logan | $147,000 | Chicago Title Company | |
| Center Roy | -- | None Available | |
| Sue Christy | $108,000 | None Available | |
| Hake Marilyn | -- | -- | |
| Phillips Lillie M | -- | -- |
Source: Public Records
Mortgage History
| Date | Status | Borrower | Loan Amount |
|---|---|---|---|
| Open | Center Logan | $156,000 | |
| Closed | Center Logan | $127,136 |
Source: Public Records
Tax History
| Year | Tax Paid | Tax Assessment Tax Assessment Total Assessment is a certain percentage of the fair market value that is determined by local assessors to be the total taxable value of land and additions on the property. | Land | Improvement |
|---|---|---|---|---|
| 2025 | $2,125 | $176,662 | $24,033 | $152,629 |
| 2023 | $2,125 | $169,803 | $23,100 | $146,703 |
| 2022 | $1,945 | $166,475 | $22,648 | $143,827 |
| 2021 | $1,923 | $163,211 | $22,204 | $141,007 |
| 2020 | $1,908 | $161,539 | $21,977 | $139,562 |
| 2019 | $1,871 | $158,373 | $21,547 | $136,826 |
| 2018 | $1,813 | $155,269 | $21,125 | $134,144 |
| 2017 | $1,759 | $152,225 | $20,711 | $131,514 |
| 2016 | $1,747 | $149,241 | $20,305 | $128,936 |
| 2015 | $770 | $47,968 | $15,989 | $31,979 |
| 2014 | -- | $47,029 | $15,676 | $31,353 |
Source: Public Records
Map
Nearby Homes
- 1872 6th Ave
- 4827 Olivehurst Ave
- 1829 8th Ave
- 1906 Chapman Ave
- 4745 Olivehurst Ave
- 757 Pacific Grove Way
- 5057 Canal St
- 1651 3rd Ave
- 4803 Pacific Ave
- 5192 Chestnut Rd
- 4859 Arboga Rd
- 4738 Fleming Way
- 4654 Powerline Rd
- 4600 Olivehurst Ave
- 1519 9th Ave
- 1527 9th Ave
- 4694 Pacific Ave
- 4688 Pacific Ave
- 5270 Aspen Way
- 5277 Aspen Way
- 4893 Okmulgee Ave
- 4921 Okmulgee Ave
- 4915 Okmulgee Ave
- 1813 7th Ave Unit A & B
- 4920 Okmulgee Ave
- 4934 Okmulgee Ave
- 4909 Okmulgee Ave
- 4914 Okmulgee Ave
- 4905 Okmulgee Ave
- 1794 6th Ave
- 4902 Okmulgee Ave
- 1817 7th Ave
- 4901 Okmulgee Ave
- 1802 6th Ave
- 4896 Okmulgee Ave
- 1834 6th Ave
- 4931 Olivehurst Ave
- 1826 6th Ave
- 4935 Olivehurst Ave
- 1790 6th Ave
Your Personal Tour Guide
Ask me questions while you tour the home.