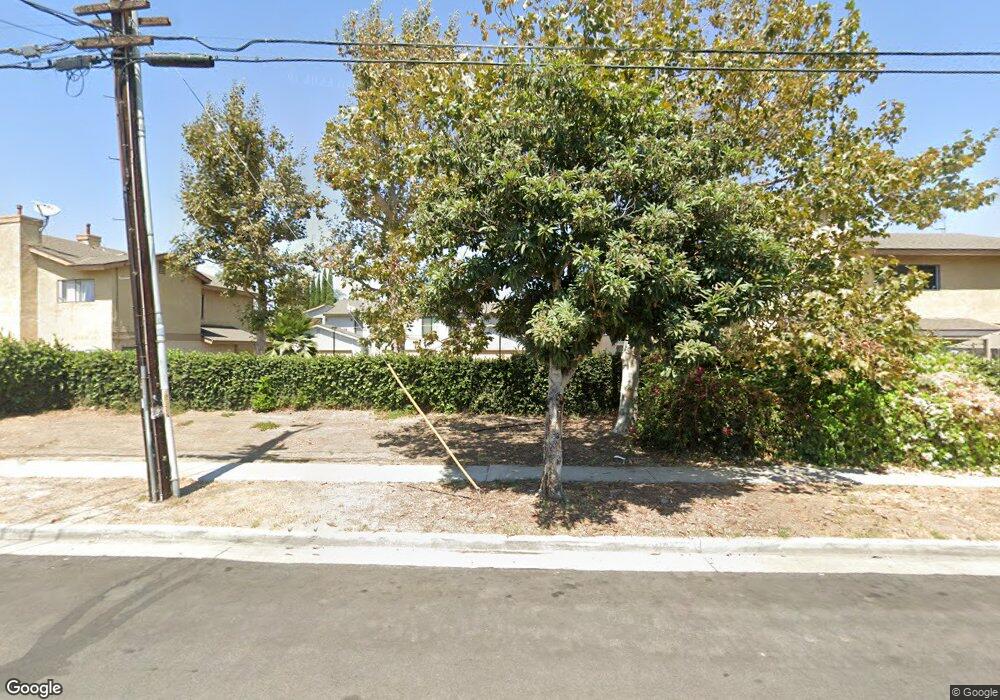
4929 Redwood Dr Santa Ana, CA 92703
Riverview West NeighborhoodEstimated Value: $748,461 - $909,000
3
Beds
3
Baths
1,341
Sq Ft
$622/Sq Ft
Est. Value
About This Home
This home is located at 4929 Redwood Dr, Santa Ana, CA 92703 and is currently estimated at $833,865, approximately $621 per square foot. 4929 Redwood Dr is a home located in Orange County with nearby schools including Rosita Elementary School, James Irvine Intermediate School, and Los Amigos High School.
Ownership History
Date
Name
Owned For
Owner Type
Purchase Details
Closed on
Jul 16, 2019
Sold by
Tran Kevin
Bought by
Nguyen Christy
Current Estimated Value
Purchase Details
Closed on
Jun 4, 2010
Sold by
Nguyen Christy
Bought by
Tran Kevin
Home Financials for this Owner
Home Financials are based on the most recent Mortgage that was taken out on this home.
Original Mortgage
$224,000
Interest Rate
4.52%
Mortgage Type
New Conventional
Purchase Details
Closed on
Jun 2, 2010
Sold by
Vu Tracy Trang and Duong Dennis V
Bought by
Tran Kevin
Home Financials for this Owner
Home Financials are based on the most recent Mortgage that was taken out on this home.
Original Mortgage
$224,000
Interest Rate
4.52%
Mortgage Type
New Conventional
Purchase Details
Closed on
Jan 23, 2002
Sold by
Khalife Ahmad J and Khalife Paula F
Bought by
Duong Dennis and Vu Tracy Trang
Home Financials for this Owner
Home Financials are based on the most recent Mortgage that was taken out on this home.
Original Mortgage
$161,200
Interest Rate
7.04%
Create a Home Valuation Report for This Property
The Home Valuation Report is an in-depth analysis detailing your home's value as well as a comparison with similar homes in the area
Home Values in the Area
Average Home Value in this Area
Purchase History
| Date | Buyer | Sale Price | Title Company |
|---|---|---|---|
| Nguyen Christy | -- | Accommodation | |
| Tran Kevin | -- | Western Resources Title Co | |
| Tran Kevin | $285,000 | Western Resources Title Co | |
| Duong Dennis | $201,500 | American Title Co |
Source: Public Records
Mortgage History
| Date | Status | Borrower | Loan Amount |
|---|---|---|---|
| Previous Owner | Tran Kevin | $224,000 | |
| Previous Owner | Duong Dennis | $161,200 |
Source: Public Records
Tax History Compared to Growth
Tax History
| Year | Tax Paid | Tax Assessment Tax Assessment Total Assessment is a certain percentage of the fair market value that is determined by local assessors to be the total taxable value of land and additions on the property. | Land | Improvement |
|---|---|---|---|---|
| 2025 | $4,297 | $365,131 | $247,637 | $117,494 |
| 2024 | $4,297 | $357,972 | $242,781 | $115,191 |
| 2023 | $4,216 | $350,953 | $238,020 | $112,933 |
| 2022 | $4,119 | $344,072 | $233,353 | $110,719 |
| 2021 | $4,062 | $337,326 | $228,777 | $108,549 |
| 2020 | $4,012 | $333,868 | $226,432 | $107,436 |
| 2019 | $4,037 | $327,322 | $221,992 | $105,330 |
| 2018 | $3,938 | $320,904 | $217,639 | $103,265 |
| 2017 | $3,899 | $314,612 | $213,371 | $101,241 |
| 2016 | $3,730 | $308,444 | $209,188 | $99,256 |
| 2015 | $3,681 | $303,811 | $206,045 | $97,766 |
| 2014 | $3,595 | $297,860 | $202,009 | $95,851 |
Source: Public Records
Map
Nearby Homes
- 4832 W 5th St Unit B
- 14376 Euclid St Unit 1-4
- 323 N Euclid St Unit 99
- 13322 Euclid St
- 5317 Silver Dr
- 10886 Lotus Dr
- 5405 W 4th St
- 5114 W 1st St Unit C
- 5112 W 1st St Unit C
- 4518 W 1st St
- 5132 W 1st St Unit B
- 14356 Taft St
- 4248 W 5th St
- 4201 W 5th St Unit 314
- 1114 N Gates St
- 1609 N Parsons Place
- 3932 W 5th St Unit 202
- 3929 W 5th St Unit 16
- 11321 Parkgreen Ln Unit 102
- 14151 Lake St
- 4925 Redwood Dr
- 4933 Redwood Dr
- 4921 Redwood Dr
- 4937 Redwood Dr
- 738 Elmwood Dr
- 734 Elmwood Dr
- 730 Elmwood Dr
- 4926 Redwood Dr
- 726 Elmwood Dr
- 4938 Redwood Dr
- 4922 Redwood Dr
- 4942 Redwood Dr
- 722 Elmwood Dr
- 4918 Redwood Dr
- 4946 Redwood Dr
- 4914 Redwood Dr
- 4950 Redwood Dr
- 4910 Redwood Dr
- 801 Amberwood Dr
- 4954 Redwood Dr