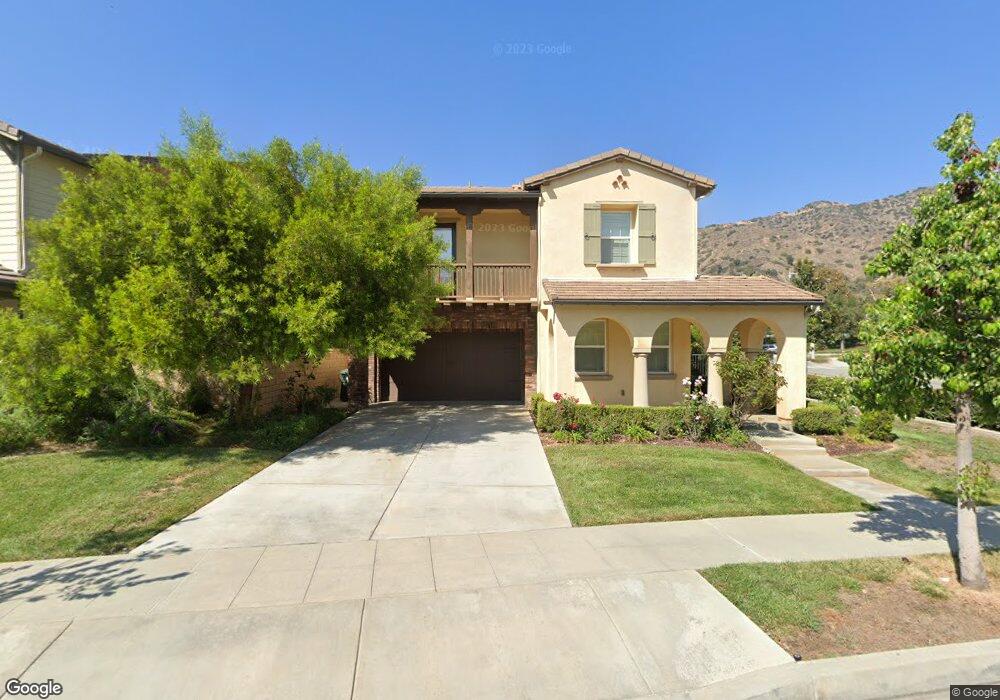
493 Desert Willow Rd Azusa, CA 91702
Rosedale NeighborhoodEstimated Value: $1,368,000 - $1,498,000
5
Beds
4
Baths
3,450
Sq Ft
$419/Sq Ft
Est. Value
About This Home
This home is located at 493 Desert Willow Rd, Azusa, CA 91702 and is currently estimated at $1,446,679, approximately $419 per square foot. 493 Desert Willow Rd is a home located in Los Angeles County with nearby schools including Henry Dalton Elementary School, Azusa High School, and St. Frances of Rome School.
Ownership History
Date
Name
Owned For
Owner Type
Purchase Details
Closed on
Feb 7, 2013
Sold by
Cityview Rosedale 98 Lp
Bought by
Chu Edward and Chu Grace
Current Estimated Value
Home Financials for this Owner
Home Financials are based on the most recent Mortgage that was taken out on this home.
Original Mortgage
$400,000
Interest Rate
2.62%
Mortgage Type
New Conventional
Purchase Details
Closed on
Jun 27, 2011
Sold by
Cityview Rosedale 98 Lp
Bought by
North Rosedale Community Association
Purchase Details
Closed on
Jan 4, 2011
Sold by
Cityview Rosedale 98 Lp
Bought by
North Rosedale Community Association
Purchase Details
Closed on
Jul 7, 2008
Sold by
Plc Magnolia Llc
Bought by
Jpmorgan Chase Bank Na
Create a Home Valuation Report for This Property
The Home Valuation Report is an in-depth analysis detailing your home's value as well as a comparison with similar homes in the area
Home Values in the Area
Average Home Value in this Area
Purchase History
| Date | Buyer | Sale Price | Title Company |
|---|---|---|---|
| Chu Edward | $680,000 | First American Title Company | |
| North Rosedale Community Association | -- | First American Title | |
| North Rosedale Community Association | -- | First American Title | |
| Jpmorgan Chase Bank Na | $10,240,000 | Accommodation |
Source: Public Records
Mortgage History
| Date | Status | Borrower | Loan Amount |
|---|---|---|---|
| Previous Owner | Chu Edward | $400,000 |
Source: Public Records
Tax History
| Year | Tax Paid | Tax Assessment Tax Assessment Total Assessment is a certain percentage of the fair market value that is determined by local assessors to be the total taxable value of land and additions on the property. | Land | Improvement |
|---|---|---|---|---|
| 2025 | $18,231 | $1,273,448 | $624,520 | $648,928 |
| 2024 | $17,689 | $1,248,479 | $612,275 | $636,204 |
| 2023 | $17,217 | $1,224,000 | $600,270 | $623,730 |
| 2022 | $16,951 | $1,200,000 | $588,500 | $611,500 |
| 2021 | $11,803 | $773,593 | $293,055 | $480,538 |
| 2019 | $11,688 | $750,650 | $284,364 | $466,286 |
| 2018 | $12,389 | $735,933 | $278,789 | $457,144 |
| 2016 | $11,836 | $707,358 | $267,964 | $439,394 |
| 2015 | $11,631 | $696,733 | $263,939 | $432,794 |
| 2014 | $10,988 | $683,086 | $258,769 | $424,317 |
Source: Public Records
Map
Nearby Homes
- 579 E Sierra Madre Ave
- 510 E Viewcrest Dr
- 579 Boxwood Ln
- 1124 N Soldano Dr
- 653 E Gardenia Dr
- 687 Lemon Swirl Dr
- 1215 N San Gabriel Ave Unit 309
- 665 E Tangerine St
- 0 0 Unit IG25061470
- 302 Monroe Ct
- 915 N Pasadena Ave
- 109 E 9th St
- 121 W 9th St Unit 25
- 824 N Pasadena Ave Unit 31
- 226 Star Pine Ct
- 1774 Shady Oaks Ct Unit 116
- 1783 Shady Oaks Ct
- 202 Evergreen Ct
- 1770 Crystal Canyon Dr
- 810 E Promenade Unit C
- 484 Desert Willow Rd
- 487 Desert Willow Rd
- 490 E Desert Willow Rd
- 478 E Desert Willow Rd
- 493 E Desert Willow Rd
- 481 E Desert Willow Rd
- 496 E Desert Willow Rd
- 472 E Desert Willow Rd
- 472 Desert Willow Rd
- 466 E Desert Willow Rd
- 499 Desert Willow Rd
- 491 E Oak Ct
- 497 E Oak Ct
- 485 E Oak Ct
- 1308 N Vosburg Dr
- 1366 N Vosburg Dr
- 505 Desert Willow Rd
- 1360 N Vosburg Dr
- 511 E Desert Willow Rd
- 511 E Desert Willow Rd Unit one suite
Your Personal Tour Guide
Ask me questions while you tour the home.