Estimated Value: $373,000 - $440,000
2
Beds
1
Bath
895
Sq Ft
$448/Sq Ft
Est. Value
About This Home
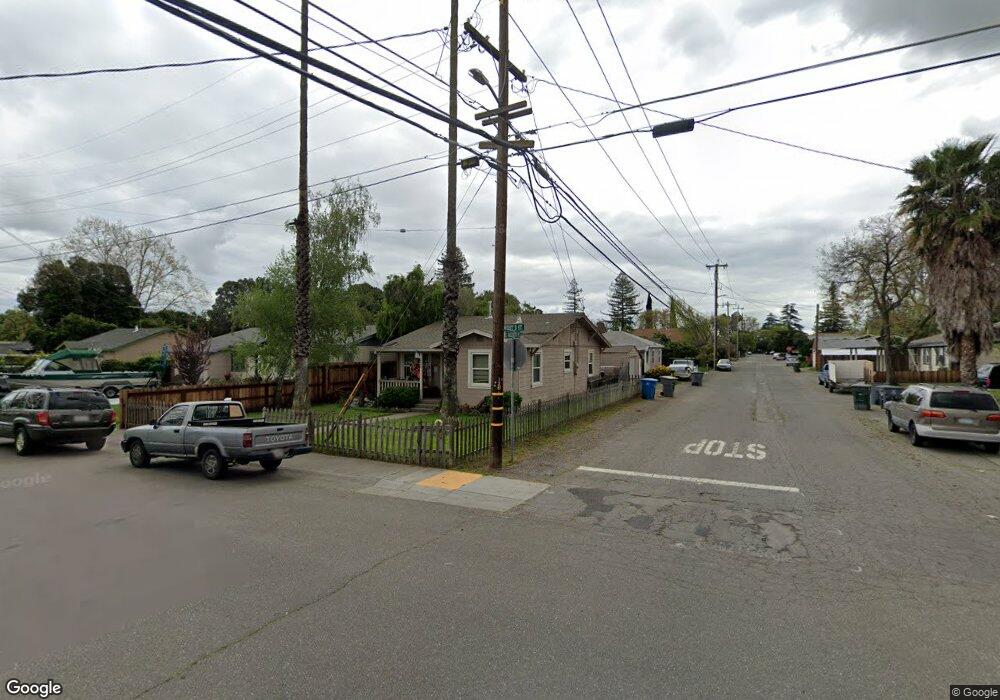
This home is located at 493 W D St, Dixon, CA 95620 and is currently estimated at $400,522, approximately $447 per square foot. 493 W D St is a home located in Solano County with nearby schools including Anderson (Linford L.) Elementary School, Dixon High School, and Dixon Montessori Charter.
Ownership History
Date
Name
Owned For
Owner Type
Purchase Details
Closed on
Apr 8, 2009
Sold by
Siebels Jeremy and Siebels Janet
Bought by
Penner Rick Wade
Current Estimated Value
Home Financials for this Owner
Home Financials are based on the most recent Mortgage that was taken out on this home.
Original Mortgage
$150,058
Outstanding Balance
$95,267
Interest Rate
5.02%
Mortgage Type
VA
Estimated Equity
$305,255
Purchase Details
Closed on
May 25, 2006
Sold by
Stephens Kirk and Howard Erin
Bought by
Siebels Jeremy and Siebels Janet
Home Financials for this Owner
Home Financials are based on the most recent Mortgage that was taken out on this home.
Original Mortgage
$32,300
Interest Rate
6.55%
Mortgage Type
Stand Alone Second
Purchase Details
Closed on
May 7, 1992
Sold by
Stephens Mark
Bought by
The Stephens Trust
Create a Home Valuation Report for This Property
The Home Valuation Report is an in-depth analysis detailing your home's value as well as a comparison with similar homes in the area
Home Values in the Area
Average Home Value in this Area
Purchase History
| Date | Buyer | Sale Price | Title Company |
|---|---|---|---|
| Penner Rick Wade | $147,000 | Placer Title Company | |
| Siebels Jeremy | $323,000 | Fidelity National Title Co | |
| The Stephens Trust | -- | -- |
Source: Public Records
Mortgage History
| Date | Status | Borrower | Loan Amount |
|---|---|---|---|
| Open | Penner Rick Wade | $150,058 | |
| Previous Owner | Siebels Jeremy | $32,300 | |
| Previous Owner | Siebels Jeremy | $290,700 |
Source: Public Records
Tax History Compared to Growth
Tax History
| Year | Tax Paid | Tax Assessment Tax Assessment Total Assessment is a certain percentage of the fair market value that is determined by local assessors to be the total taxable value of land and additions on the property. | Land | Improvement |
|---|---|---|---|---|
| 2025 | $2,467 | $189,159 | $64,380 | $124,779 |
| 2024 | $2,467 | $185,451 | $63,118 | $122,333 |
| 2023 | $1,963 | $181,816 | $61,881 | $119,935 |
| 2022 | $3,372 | $178,252 | $60,668 | $117,584 |
| 2021 | $2,413 | $174,758 | $59,479 | $115,279 |
| 2020 | $2,365 | $172,967 | $58,870 | $114,097 |
| 2019 | $3,033 | $169,576 | $57,716 | $111,860 |
| 2018 | $2,313 | $166,252 | $56,585 | $109,667 |
| 2017 | $2,224 | $162,993 | $55,476 | $107,517 |
| 2016 | $1,871 | $159,798 | $54,389 | $105,409 |
| 2015 | $1,659 | $157,399 | $53,573 | $103,826 |
| 2014 | $2,049 | $154,317 | $52,524 | $101,793 |
Source: Public Records
Map
Nearby Homes
- 621 W D St S
- 741 W D St S
- 22 Sierra Dr
- 650 Marvin Way
- 700 W A St
- 610 Sierra Dr
- 10 Solano Dr
- 540 Glenside Dr
- 241 S 1st St
- 1535 Eisenhower Ct
- 640 Berkshire Dr
- 550 N Lincoln St
- 715 Berkshire Ct
- 2290 Maze Way
- 2285 Maze Way
- 205 W Cherry St
- 255 Alderglen Dr
- 1150 Mulberry Ln
- 720 E Creekside Cir
- 920 N Lincoln St