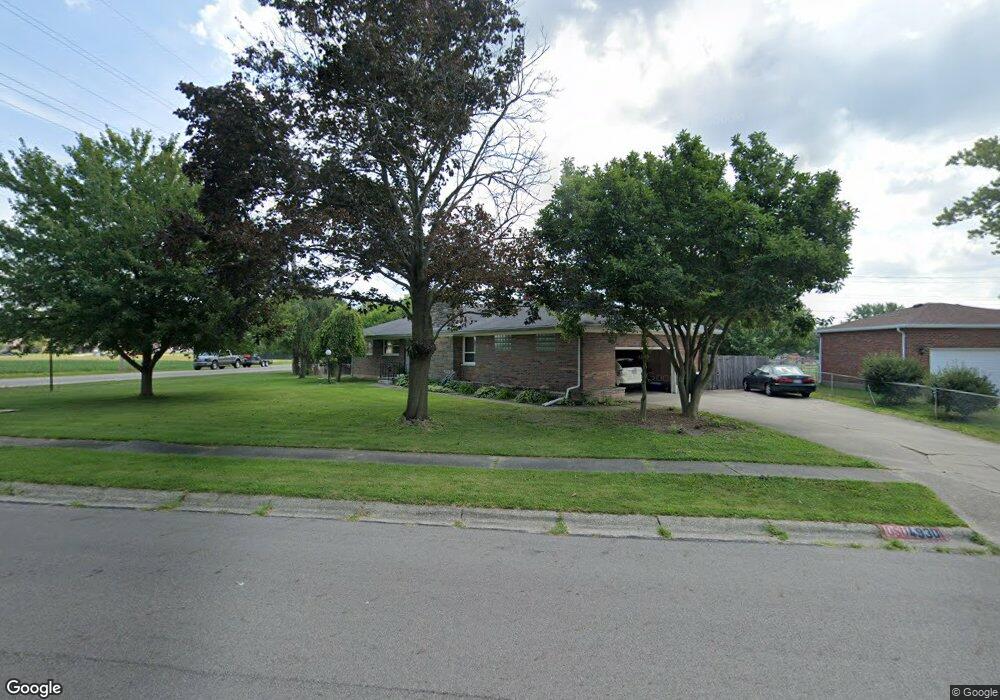
4930 Tulane Rd Springfield, OH 45503
Estimated Value: $218,000 - $250,000
3
Beds
2
Baths
1,421
Sq Ft
$164/Sq Ft
Est. Value
About This Home
This home is located at 4930 Tulane Rd, Springfield, OH 45503 and is currently estimated at $232,879, approximately $163 per square foot. 4930 Tulane Rd is a home located in Clark County with nearby schools including Rolling Hills Elementary School, Jose Antonio Navarro Elementary School, and Northridge Elementary School.
Ownership History
Date
Name
Owned For
Owner Type
Purchase Details
Closed on
Jul 21, 2015
Sold by
Williger Sheryl L and Bower Sheryl L
Bought by
Evans Cindy
Current Estimated Value
Home Financials for this Owner
Home Financials are based on the most recent Mortgage that was taken out on this home.
Original Mortgage
$87,295
Outstanding Balance
$67,855
Interest Rate
4.01%
Mortgage Type
New Conventional
Estimated Equity
$165,024
Purchase Details
Closed on
Mar 9, 2007
Sold by
Bower Matthew E
Bought by
Bower Sheryl L
Purchase Details
Closed on
Mar 19, 2003
Sold by
Bank One Na
Bought by
Bower Matthew E and Bower Sheryl L
Home Financials for this Owner
Home Financials are based on the most recent Mortgage that was taken out on this home.
Original Mortgage
$82,650
Interest Rate
5.95%
Mortgage Type
Purchase Money Mortgage
Purchase Details
Closed on
Oct 22, 2002
Sold by
Ledingham Sally J
Bought by
Bank One Na
Purchase Details
Closed on
Sep 25, 1998
Sold by
Ledingham Ethel Irene and Ledingham Irene E
Bought by
Ledingham Michael W and Ledingham Saly J
Create a Home Valuation Report for This Property
The Home Valuation Report is an in-depth analysis detailing your home's value as well as a comparison with similar homes in the area
Home Values in the Area
Average Home Value in this Area
Purchase History
| Date | Buyer | Sale Price | Title Company |
|---|---|---|---|
| Evans Cindy | $85,000 | Attorney | |
| Bower Sheryl L | -- | Attorney | |
| Bower Matthew E | $87,000 | -- | |
| Bank One Na | $90,000 | -- | |
| Ledingham Michael W | -- | -- |
Source: Public Records
Mortgage History
| Date | Status | Borrower | Loan Amount |
|---|---|---|---|
| Open | Evans Cindy | $87,295 | |
| Previous Owner | Bower Matthew E | $82,650 |
Source: Public Records
Tax History Compared to Growth
Tax History
| Year | Tax Paid | Tax Assessment Tax Assessment Total Assessment is a certain percentage of the fair market value that is determined by local assessors to be the total taxable value of land and additions on the property. | Land | Improvement |
|---|---|---|---|---|
| 2025 | $2,479 | $77,180 | $20,980 | $56,200 |
| 2024 | $2,479 | $56,690 | $14,040 | $42,650 |
| 2023 | $2,397 | $56,690 | $14,040 | $42,650 |
| 2022 | $2,406 | $56,690 | $14,040 | $42,650 |
| 2021 | $2,267 | $45,260 | $11,140 | $34,120 |
| 2020 | $2,269 | $45,260 | $11,140 | $34,120 |
| 2019 | $2,312 | $45,260 | $11,140 | $34,120 |
| 2018 | $2,380 | $44,730 | $9,990 | $34,740 |
| 2017 | $2,040 | $45,381 | $9,989 | $35,392 |
| 2016 | $2,026 | $45,381 | $9,989 | $35,392 |
| 2015 | $2,114 | $43,008 | $9,604 | $33,404 |
| 2014 | $2,113 | $43,008 | $9,604 | $33,404 |
| 2013 | $2,066 | $43,008 | $9,604 | $33,404 |
Source: Public Records
Map
Nearby Homes
- 1709 Thomas Dr
- 5220 Ridgewood Rd E
- 5249 Taywell Dr
- 4446 Ridgewood Rd E Unit 3
- 1707 Berwick Dr
- 4423 Tacoma St
- 4712 Cullen Ave
- 1836 Dunseth Ln
- 1043 Westmont Dr
- 970 Forest Edge Ave
- Pendleton Plan at
- Holcombe Plan at
- Newcastle Plan at
- Chatham Plan at
- 1708 New Castle Ln
- 4135 Anoka St
- 916 Sawmill Ct
- 862 Brendle Trace Unit 20
- 1910 Delmar Dr
- 4455 Derr Rd
- 4920 Tulane Rd
- 4931 Tulane Rd
- 4910 Tulane Rd
- 4911 Tulane Rd
- 1734 Thomas Dr
- 4900 Tulane Rd
- 1733 Thomas Dr
- 1740 Merrydale Rd
- 1726 Thomas Dr
- 1725 Thomas Dr
- 1732 Merrydale Rd
- 1718 Thomas Dr
- 1724 Merrydale Rd
- 4834 Tulane Rd
- 1809 Merrydale Rd
- 1717 Thomas Dr
- 1739 Merrydale Rd
- 1710 Thomas Dr
- 1716 Merrydale Rd
- 5065 Crandall Ln