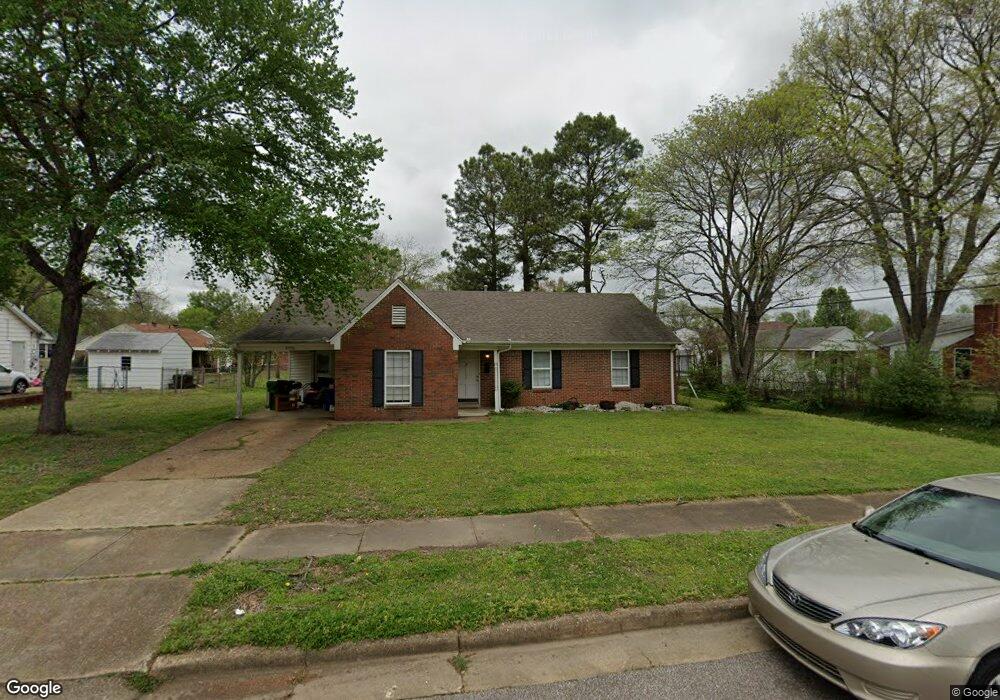
4930 Waycross Ave Millington, TN 38053
Estimated Value: $205,642 - $229,000
3
Beds
2
Baths
1,473
Sq Ft
$146/Sq Ft
Est. Value
About This Home
This home is located at 4930 Waycross Ave, Millington, TN 38053 and is currently estimated at $215,411, approximately $146 per square foot. 4930 Waycross Ave is a home located in Shelby County with nearby schools including Millington Elementary School, Millington High School, and Faith Heritage Christian Academy.
Ownership History
Date
Name
Owned For
Owner Type
Purchase Details
Closed on
Jul 31, 2008
Sold by
Day David Marcus and Day Amanda K
Bought by
Ross Jennifer Lynn and Fisher Christopher David
Current Estimated Value
Home Financials for this Owner
Home Financials are based on the most recent Mortgage that was taken out on this home.
Original Mortgage
$56,500
Outstanding Balance
$37,155
Interest Rate
6.37%
Mortgage Type
Purchase Money Mortgage
Estimated Equity
$178,256
Purchase Details
Closed on
Apr 25, 2003
Sold by
Day David Marcus
Bought by
Day David Marcus and Day Amanda K
Home Financials for this Owner
Home Financials are based on the most recent Mortgage that was taken out on this home.
Original Mortgage
$75,950
Interest Rate
5.86%
Mortgage Type
Purchase Money Mortgage
Purchase Details
Closed on
Jun 4, 1999
Sold by
Carden James L and Carden Vivian A
Bought by
Day David Marcus
Home Financials for this Owner
Home Financials are based on the most recent Mortgage that was taken out on this home.
Original Mortgage
$43,000
Interest Rate
6.94%
Create a Home Valuation Report for This Property
The Home Valuation Report is an in-depth analysis detailing your home's value as well as a comparison with similar homes in the area
Home Values in the Area
Average Home Value in this Area
Purchase History
| Date | Buyer | Sale Price | Title Company |
|---|---|---|---|
| Ross Jennifer Lynn | $106,500 | None Available | |
| Day David Marcus | -- | Fidelity Title & Escrow Inc | |
| Day David Marcus | $82,470 | Security Title Company Inc |
Source: Public Records
Mortgage History
| Date | Status | Borrower | Loan Amount |
|---|---|---|---|
| Open | Ross Jennifer Lynn | $56,500 | |
| Previous Owner | Day David Marcus | $75,950 | |
| Previous Owner | Day David Marcus | $43,000 |
Source: Public Records
Tax History Compared to Growth
Tax History
| Year | Tax Paid | Tax Assessment Tax Assessment Total Assessment is a certain percentage of the fair market value that is determined by local assessors to be the total taxable value of land and additions on the property. | Land | Improvement |
|---|---|---|---|---|
| 2025 | -- | $44,050 | $5,900 | $38,150 |
| 2024 | -- | $32,450 | $4,900 | $27,550 |
| 2023 | $1,554 | $32,450 | $4,900 | $27,550 |
| 2022 | $1,554 | $32,450 | $4,900 | $27,550 |
| 2021 | $1,574 | $32,450 | $4,900 | $27,550 |
| 2020 | $1,267 | $22,700 | $4,675 | $18,025 |
| 2019 | $919 | $22,700 | $4,675 | $18,025 |
| 2018 | $1,267 | $22,700 | $4,675 | $18,025 |
| 2017 | $1,280 | $22,700 | $4,675 | $18,025 |
| 2016 | $1,261 | $21,375 | $0 | $0 |
| 2014 | $934 | $21,375 | $0 | $0 |
Source: Public Records
Map
Nearby Homes
- 7206 Juana Dr
- 7202 Renda St
- 7163 Pam Dr
- 4917 Hallbrook Dr
- KERRY Plan at Riggs Pointe
- Cali Plan at Riggs Pointe
- Aria Plan at Riggs Pointe
- 7011 Alder Wood Dr
- 7266 Raleigh Millington Rd
- 4315 Peach Run Lane Ln
- 4703 Cedar Rose Dr
- 4325 Peach Run Lane Ln
- 4310 Peach Run Lane Ln
- 4321 Peach Run Ln
- 4306 Peach Run Ln
- 4302 Peach Run Lane Ln
- 4537 Basun Cir S
- 4288 Peach Run Lane Ln
- 4600 Goldsby Place
- 4274 Peach Run Lane Ln