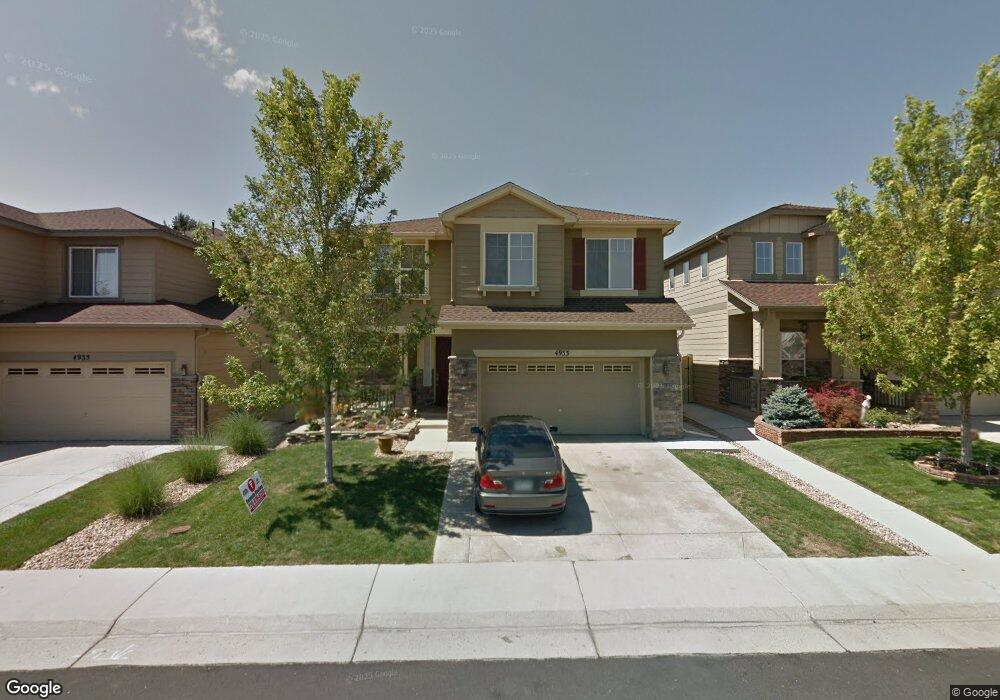
4933 S Zephyr St Littleton, CO 80123
Grant Ranch NeighborhoodEstimated Value: $653,406 - $689,000
3
Beds
2
Baths
1,925
Sq Ft
$349/Sq Ft
Est. Value
About This Home
This home is located at 4933 S Zephyr St, Littleton, CO 80123 and is currently estimated at $671,602, approximately $348 per square foot. 4933 S Zephyr St is a home located in Jefferson County with nearby schools including Blue Heron Elementary School, Summit Ridge Middle School, and Dakota Ridge Senior High School.
Ownership History
Date
Name
Owned For
Owner Type
Purchase Details
Closed on
Oct 25, 2011
Sold by
Chikov Jennie Y and Chikov Oleg U
Bought by
Li Sheng R
Current Estimated Value
Home Financials for this Owner
Home Financials are based on the most recent Mortgage that was taken out on this home.
Original Mortgage
$192,000
Outstanding Balance
$19,550
Interest Rate
4.13%
Mortgage Type
New Conventional
Estimated Equity
$652,052
Purchase Details
Closed on
Jan 24, 2011
Sold by
Chikov Jennie Y
Bought by
Chikov Jennie Y and Chikov Oleg I
Purchase Details
Closed on
Jul 29, 2008
Sold by
Chikov Jennie Y and Chikov Oleg I
Bought by
Chikov Jennie Y
Purchase Details
Closed on
Aug 22, 2005
Sold by
Summerlane Village Llc
Bought by
Chikov Jennie Y and Chikov Oleg I
Home Financials for this Owner
Home Financials are based on the most recent Mortgage that was taken out on this home.
Original Mortgage
$225,076
Interest Rate
5.87%
Mortgage Type
New Conventional
Create a Home Valuation Report for This Property
The Home Valuation Report is an in-depth analysis detailing your home's value as well as a comparison with similar homes in the area
Home Values in the Area
Average Home Value in this Area
Purchase History
| Date | Buyer | Sale Price | Title Company |
|---|---|---|---|
| Li Sheng R | $240,000 | Capital Title Llc | |
| Chikov Jennie Y | -- | None Available | |
| Chikov Jennie Y | -- | None Available | |
| Chikov Jennie Y | $281,346 | Security Title |
Source: Public Records
Mortgage History
| Date | Status | Borrower | Loan Amount |
|---|---|---|---|
| Open | Li Sheng R | $192,000 | |
| Previous Owner | Chikov Jennie Y | $225,076 |
Source: Public Records
Tax History Compared to Growth
Tax History
| Year | Tax Paid | Tax Assessment Tax Assessment Total Assessment is a certain percentage of the fair market value that is determined by local assessors to be the total taxable value of land and additions on the property. | Land | Improvement |
|---|---|---|---|---|
| 2024 | $3,763 | $38,417 | $9,912 | $28,505 |
| 2023 | $3,763 | $38,417 | $9,912 | $28,505 |
| 2022 | $3,295 | $33,032 | $9,619 | $23,413 |
| 2021 | $3,337 | $33,983 | $9,896 | $24,087 |
| 2020 | $2,880 | $29,394 | $7,705 | $21,689 |
| 2019 | $2,844 | $29,394 | $7,705 | $21,689 |
| 2018 | $2,835 | $28,293 | $8,681 | $19,612 |
| 2017 | $2,587 | $28,293 | $8,681 | $19,612 |
| 2016 | $2,481 | $26,174 | $7,587 | $18,587 |
| 2015 | $2,265 | $26,174 | $7,587 | $18,587 |
| 2014 | $2,265 | $22,412 | $7,495 | $14,917 |
Source: Public Records
Map
Nearby Homes
- 4963 S Zephyr St
- 7900 W Layton Ave Unit 833
- 7925 W Layton Ave Unit 507
- 7925 W Layton Ave Unit 529
- 4850 S Ammons St Unit 931
- 5057 S Allison Way
- 4760 S Wadsworth Blvd Unit M301
- 4760 S Wadsworth Blvd Unit E301
- 4760 S Wadsworth Blvd Unit E108
- 4899 S Dudley St Unit E1
- 4899 S Dudley St Unit 11A
- 4899 S Dudley St Unit 2
- 4899 S Dudley St Unit 4H
- 4899 S Dudley St Unit 14F
- 4760 S Wadsworth Blvd Unit G 101
- 4896 S Dudley St Unit 10-7
- 4896 S Dudley St Unit 9-10
- 4896 S Dudley St Unit 7-7
- 4896 S Dudley St Unit 8-2
- 7169 W Belmont Dr
- 4925 S Zephyr St
- 4923 S Zephyr St
- 4943 S Zephyr St
- 4953 S Zephyr St
- 4932 S Zephyr St
- 4924 S Zephyr St
- 4922 S Zephyr St
- 4903 S Zephyr St
- 4912 S Zephyr St
- 8063 W Chenango Place
- 4934 S Zephyr St
- 4952 S Zephyr St
- 8053 W Chenango Place
- 4902 S Zephyr St
- 4962 S Zephyr St
- 4973 S Zephyr St
- 4893 S Zephyr St
- 7856 W Layton Way
- 7858 W Layton Way
- 7868 W Layton Way