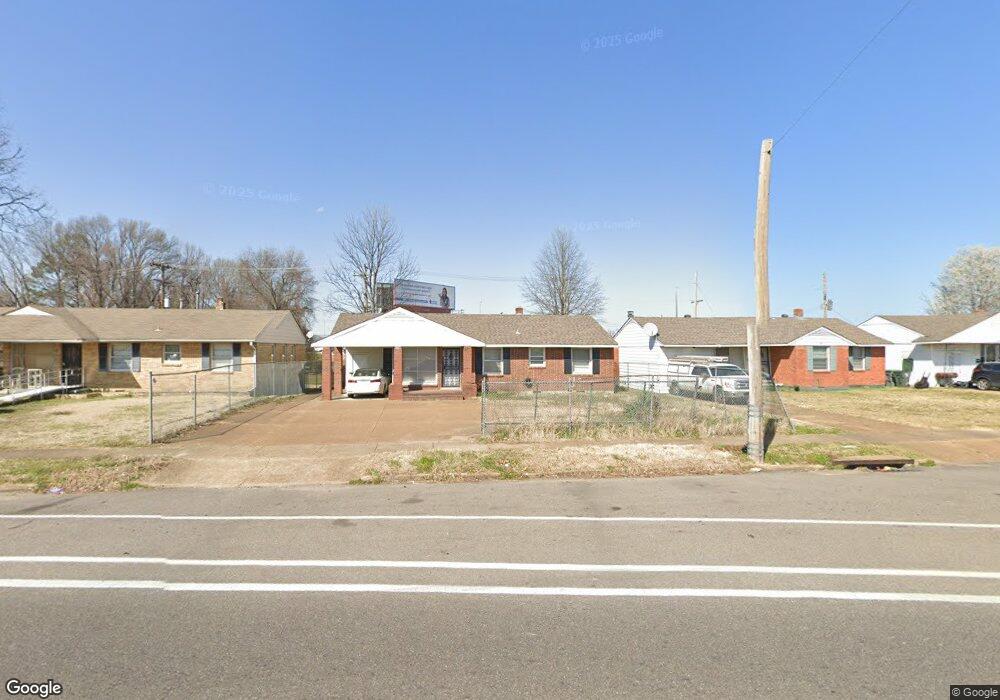
4942 Macon Rd Memphis, TN 38122
Berclair NeighborhoodEstimated Value: $144,208 - $183,000
3
Beds
2
Baths
1,609
Sq Ft
$105/Sq Ft
Est. Value
About This Home
This home is located at 4942 Macon Rd, Memphis, TN 38122 and is currently estimated at $168,802, approximately $104 per square foot. 4942 Macon Rd is a home located in Shelby County with nearby schools including Berclair Elementary School, Kingsbury High School, and Treadwell Middle School.
Ownership History
Date
Name
Owned For
Owner Type
Purchase Details
Closed on
Dec 27, 2011
Sold by
The Secretary Of Housing & Urban Develop
Bought by
El Agha Hussam
Current Estimated Value
Purchase Details
Closed on
Oct 3, 2011
Sold by
Hernandez Luis and Hernandez Graciela
Bought by
The Secretary Of Housing & Urban Develop
Purchase Details
Closed on
Jul 30, 2008
Sold by
Hernandez Luis
Bought by
Hernandez Graciela
Purchase Details
Closed on
Nov 30, 2000
Sold by
Bridges Jenetta C
Bought by
Hernandez Luis
Home Financials for this Owner
Home Financials are based on the most recent Mortgage that was taken out on this home.
Original Mortgage
$77,858
Interest Rate
7.71%
Mortgage Type
FHA
Purchase Details
Closed on
Aug 14, 2000
Sold by
Kolbe Linda Ann and Kolbe Jennifer
Bought by
Bridges Jennita C
Purchase Details
Closed on
Jul 28, 1999
Sold by
Bridges Jenetta C
Bought by
Kolbe Linda Ann and Kolbe Jennifer
Create a Home Valuation Report for This Property
The Home Valuation Report is an in-depth analysis detailing your home's value as well as a comparison with similar homes in the area
Home Values in the Area
Average Home Value in this Area
Purchase History
| Date | Buyer | Sale Price | Title Company |
|---|---|---|---|
| El Agha Hussam | $50,000 | None Available | |
| The Secretary Of Housing & Urban Develop | $81,301 | None Available | |
| Hernandez Graciela | -- | None Available | |
| Hernandez Luis | $78,500 | -- | |
| Bridges Jennita C | -- | -- | |
| Kolbe Linda Ann | -- | -- |
Source: Public Records
Mortgage History
| Date | Status | Borrower | Loan Amount |
|---|---|---|---|
| Previous Owner | Hernandez Luis | $77,858 |
Source: Public Records
Tax History Compared to Growth
Tax History
| Year | Tax Paid | Tax Assessment Tax Assessment Total Assessment is a certain percentage of the fair market value that is determined by local assessors to be the total taxable value of land and additions on the property. | Land | Improvement |
|---|---|---|---|---|
| 2025 | -- | $36,450 | $4,400 | $32,050 |
| 2024 | $1,042 | $30,725 | $2,775 | $27,950 |
| 2023 | $1,872 | $30,725 | $2,775 | $27,950 |
| 2022 | $1,872 | $30,725 | $2,775 | $27,950 |
| 2021 | $1,894 | $30,725 | $2,775 | $27,950 |
| 2020 | $1,004 | $13,850 | $1,925 | $11,925 |
| 2019 | $1,004 | $13,850 | $1,925 | $11,925 |
| 2018 | $1,004 | $13,850 | $1,925 | $11,925 |
| 2017 | $569 | $13,850 | $1,925 | $11,925 |
| 2016 | $425 | $9,725 | $0 | $0 |
| 2014 | $425 | $9,725 | $0 | $0 |
Source: Public Records
Map
Nearby Homes
- 982 Giaroli St
- 1048 Avon Rd
- 897 Bartlett Rd
- 995 Avon Rd
- 4864 Bowen Ave
- 1105 Stratford Rd
- 994 N Perkins Rd
- 4563 Violet Ave
- 4555 Gailwood Ave
- 788 Novarese St
- 823 Novarese Ave
- 5176 White Cliff Dr
- 507 Henry Heights Dr
- 5045 Henry Heights Dr
- 4931 Princeton Grove
- 5021 Henry Heights Dr
- 5033 Henry Heights Dr
- 5137 Whitehall Ave
- 5017 Henry Heights Dr
- 4950 Princeton Rd
- 4948 Macon Rd
- 4936 Macon Rd
- 4954 Macon Rd
- 4930 Macon Rd
- 4924 Macon Rd
- 4912 Macon Rd
- 4900 Macon Rd
- 1016 Mendenhall Cove
- 1024 Mendenhall Cove
- 1032 Mendenhall Cove
- 1040 Mendenhall Cove
- 1046 Mendenhall Cove
- 1052 Mendenhall Cove
- 1015 N Mendenhall Rd
- 1015 Mendenhall Cove
- 977 N White Station Rd
- 1058 Mendenhall Cove
- 975 N White Station Rd
- 4889 Macon Rd
- 1023 Mendenhall Cove