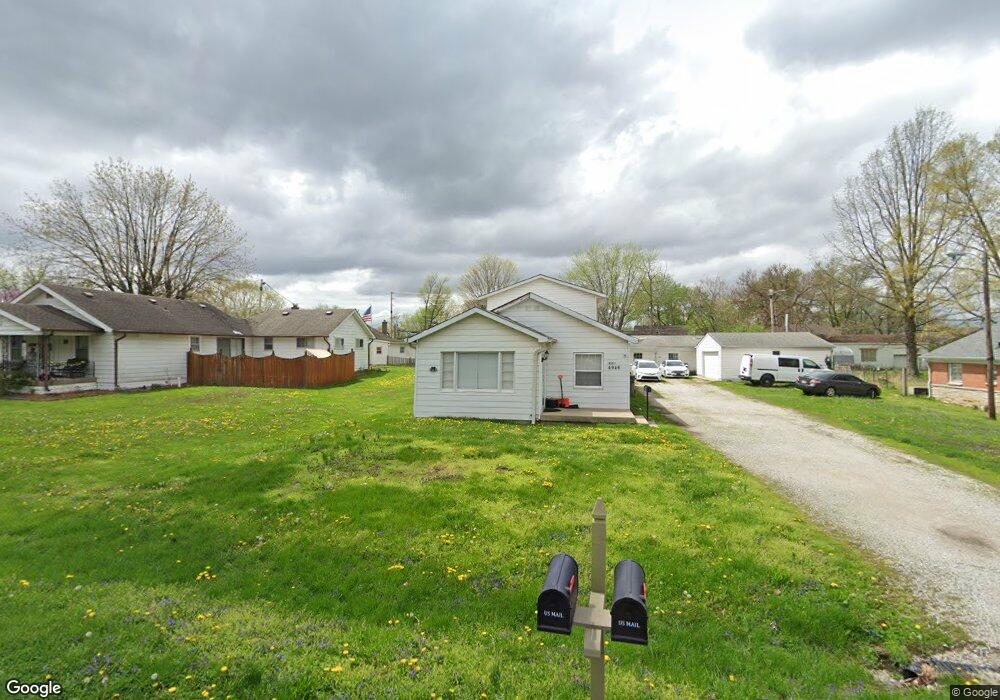
4946 Camden St Unit Little Camden Indianapolis, IN 46227
Edgewood NeighborhoodEstimated Value: $244,000 - $263,606
2
Beds
1
Bath
1,000
Sq Ft
$249/Sq Ft
Est. Value
About This Home
This home is located at 4946 Camden St Unit Little Camden, Indianapolis, IN 46227 and is currently estimated at $249,402, approximately $249 per square foot. 4946 Camden St Unit Little Camden is a home located in Marion County with nearby schools including Homecroft Elementary School, Southport 6th Grade Academy, and Southport Middle School.
Ownership History
Date
Name
Owned For
Owner Type
Purchase Details
Closed on
Aug 27, 2021
Sold by
Davis Barbara
Bought by
El-Tobgy Tamir and Teav Annie
Current Estimated Value
Home Financials for this Owner
Home Financials are based on the most recent Mortgage that was taken out on this home.
Original Mortgage
$81,030
Outstanding Balance
$73,621
Interest Rate
2.7%
Mortgage Type
New Conventional
Estimated Equity
$175,781
Purchase Details
Closed on
Jul 26, 2021
Sold by
Davis Barbara
Bought by
El Tobgy Tamir and Teav Annie
Home Financials for this Owner
Home Financials are based on the most recent Mortgage that was taken out on this home.
Original Mortgage
$81,030
Outstanding Balance
$73,621
Interest Rate
2.7%
Mortgage Type
New Conventional
Estimated Equity
$175,781
Create a Home Valuation Report for This Property
The Home Valuation Report is an in-depth analysis detailing your home's value as well as a comparison with similar homes in the area
Home Values in the Area
Average Home Value in this Area
Purchase History
| Date | Buyer | Sale Price | Title Company |
|---|---|---|---|
| El-Tobgy Tamir | -- | Quality Title | |
| El Tobgy Tamir | -- | Quality Title |
Source: Public Records
Mortgage History
| Date | Status | Borrower | Loan Amount |
|---|---|---|---|
| Open | El-Tobgy Tamir | $81,030 | |
| Closed | El Tobgy Tamir | $81,030 |
Source: Public Records
Property History
| Date | Event | Price | List to Sale | Price per Sq Ft |
|---|---|---|---|---|
| 10/11/2025 10/11/25 | Off Market | $1,400 | -- | -- |
| 09/19/2025 09/19/25 | Price Changed | $1,400 | +16.7% | $1 / Sq Ft |
| 09/19/2025 09/19/25 | Price Changed | $1,200 | -14.3% | $1 / Sq Ft |
| 09/16/2025 09/16/25 | Price Changed | $1,400 | -6.7% | $1 / Sq Ft |
| 09/10/2025 09/10/25 | Price Changed | $1,500 | -16.7% | $1 / Sq Ft |
| 08/16/2025 08/16/25 | Price Changed | $1,800 | -18.2% | $1 / Sq Ft |
| 08/13/2025 08/13/25 | Price Changed | $2,200 | 0.0% | $1 / Sq Ft |
| 08/13/2025 08/13/25 | For Rent | $2,200 | -8.3% | -- |
| 03/31/2025 03/31/25 | Off Market | $2,400 | -- | -- |
| 02/18/2025 02/18/25 | For Rent | $2,400 | 0.0% | -- |
| 02/18/2025 02/18/25 | Price Changed | $2,400 | +50.0% | $1 / Sq Ft |
| 11/29/2024 11/29/24 | Off Market | $1,600 | -- | -- |
| 10/28/2024 10/28/24 | Price Changed | $1,600 | +14.3% | $1 / Sq Ft |
| 09/28/2024 09/28/24 | For Rent | $1,400 | -- | -- |
Tax History Compared to Growth
Tax History
| Year | Tax Paid | Tax Assessment Tax Assessment Total Assessment is a certain percentage of the fair market value that is determined by local assessors to be the total taxable value of land and additions on the property. | Land | Improvement |
|---|---|---|---|---|
| 2024 | $6,017 | $255,000 | $21,200 | $233,800 |
| 2023 | $6,017 | $229,500 | $21,200 | $208,300 |
| 2022 | $5,368 | $203,000 | $21,200 | $181,800 |
| 2021 | $2,070 | $150,400 | $21,200 | $129,200 |
| 2020 | $1,899 | $138,000 | $21,200 | $116,800 |
| 2019 | $1,917 | $139,100 | $15,800 | $123,300 |
| 2018 | $1,759 | $130,400 | $15,800 | $114,600 |
| 2017 | $1,809 | $133,400 | $15,800 | $117,600 |
| 2016 | $1,761 | $130,000 | $15,800 | $114,200 |
| 2014 | $1,454 | $128,600 | $15,800 | $112,800 |
| 2013 | $1,504 | $128,600 | $15,800 | $112,800 |
Source: Public Records
Map
Nearby Homes
- 723 Ferndale Ct
- 5112 Camden St
- 849 E Elbert St
- 729 Southfield Ct
- 4855 Mount Vernon Dr
- 739 Southfield Ct
- 255 E Thompson Rd
- 935 E Dudley Ave
- 300 E Thompson Rd
- 5606 Shelby St
- 5201 Ariana Ct
- 744 Gilbert Ave
- 1134 Gilbert Ave
- 3400 Brill Rd
- 305 Bixler Rd
- 1444 E Elbert St
- 801 Stover Ave
- 1625 E Thompson Rd
- 5656 Madison Ave
- 5110 S State Ave
- 4946 Camden St
- 4946 Camden St Unit Big Camden
- 4950 Camden St
- 4930 Camden St
- 4926 Camden St
- 5002 Camden St
- 4955 Camden St
- 4929 Camden St
- 4937 Camden St
- 5012 Camden St
- 5001 Camden St
- 4910 Camden St
- 4919 Camden St
- 5011 Camden St
- 5022 Camden St
- 4901 Camden St
- 5021 Camden St
- 5032 Camden St
- 4846 Camden St
- 4970 Manker St