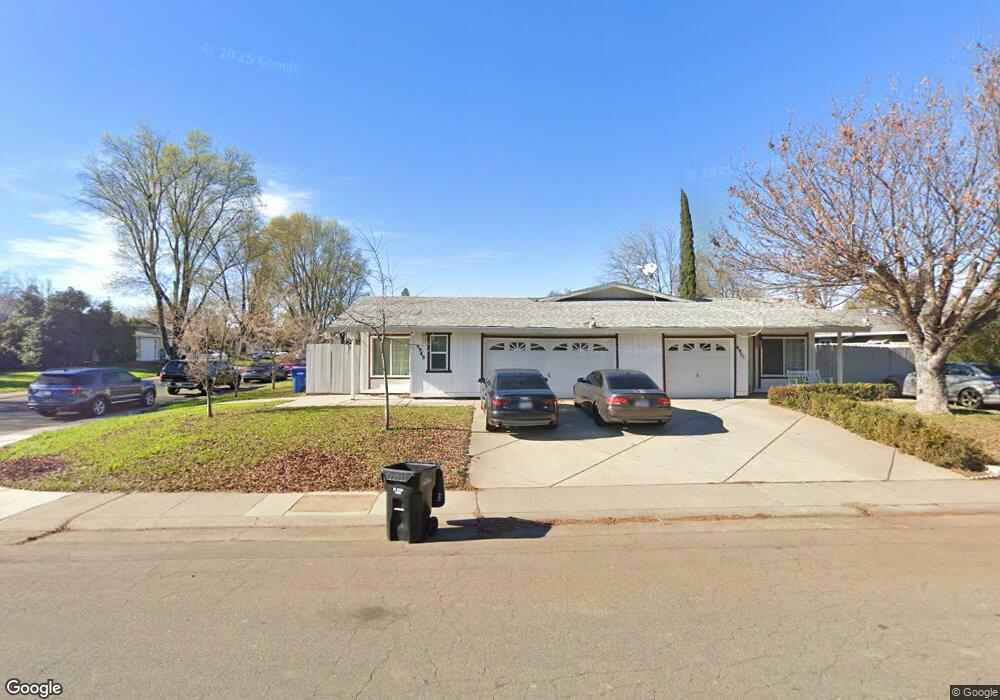
4949 Yucca Way North Highlands, CA 95660
Oakdale NeighborhoodEstimated Value: $369,000 - $508,000
4
Beds
3
Baths
2,000
Sq Ft
$233/Sq Ft
Est. Value
About This Home
This home is located at 4949 Yucca Way, North Highlands, CA 95660 and is currently estimated at $465,588, approximately $232 per square foot. 4949 Yucca Way is a home located in Sacramento County with nearby schools including Oakdale Elementary School, Foothill High School, and Community Outreach Academy Elementary School.
Ownership History
Date
Name
Owned For
Owner Type
Purchase Details
Closed on
Jun 3, 2021
Sold by
Lapatski Vasili
Bought by
Vasili Ivanovich Lapatski And Raisa Vasilyevn and Lapatski
Current Estimated Value
Home Financials for this Owner
Home Financials are based on the most recent Mortgage that was taken out on this home.
Original Mortgage
$414,000
Outstanding Balance
$381,135
Interest Rate
4.18%
Mortgage Type
Seller Take Back
Estimated Equity
$84,453
Purchase Details
Closed on
Jan 28, 2010
Sold by
Federal Home Loan Mortgage Corporation
Bought by
Lapatski Vasili
Purchase Details
Closed on
Nov 5, 2009
Sold by
Rueda Jesus Solis
Bought by
Federal Home Loan Mortgage Corporation
Purchase Details
Closed on
Oct 6, 2006
Sold by
Valdivia Cindy
Bought by
Rueda Jesus Solis
Home Financials for this Owner
Home Financials are based on the most recent Mortgage that was taken out on this home.
Original Mortgage
$79,800
Interest Rate
6.46%
Mortgage Type
Stand Alone Second
Purchase Details
Closed on
Sep 25, 2006
Sold by
Roadrunner Properties Lp
Bought by
Rueda Jesus Solis
Home Financials for this Owner
Home Financials are based on the most recent Mortgage that was taken out on this home.
Original Mortgage
$79,800
Interest Rate
6.46%
Mortgage Type
Stand Alone Second
Purchase Details
Closed on
Sep 4, 2003
Sold by
Brasier Nina
Bought by
Mouras Belton
Purchase Details
Closed on
Aug 30, 2000
Sold by
Brasier Ray H
Bought by
Brasier Nina
Home Financials for this Owner
Home Financials are based on the most recent Mortgage that was taken out on this home.
Original Mortgage
$77,000
Interest Rate
8.69%
Purchase Details
Closed on
Aug 24, 2000
Sold by
C B Morgan Family 1991 Trust and Elizabeth
Bought by
Brasier Nina
Home Financials for this Owner
Home Financials are based on the most recent Mortgage that was taken out on this home.
Original Mortgage
$77,000
Interest Rate
8.69%
Purchase Details
Closed on
Dec 22, 1999
Sold by
C B Morgan Family 1991 Trust and Elizabeth
Bought by
Morgan Elizabeth and C B Morgan 1991 Exemption Trus
Create a Home Valuation Report for This Property
The Home Valuation Report is an in-depth analysis detailing your home's value as well as a comparison with similar homes in the area
Home Values in the Area
Average Home Value in this Area
Purchase History
| Date | Buyer | Sale Price | Title Company |
|---|---|---|---|
| Vasili Ivanovich Lapatski And Raisa Vasilyevn | -- | None Listed On Document | |
| Vasili Ivanovich Lapatski And Raisa Vasilyevn | -- | None Listed On Document | |
| Lapatski Vasili | $167,000 | Lsi Title Company | |
| Federal Home Loan Mortgage Corporation | $269,528 | Accommodation | |
| Rueda Jesus Solis | -- | Fidelity National Title Co | |
| Rueda Jesus Solis | $399,000 | Fidelity National Title Co | |
| Roadrunner Properties Lp | -- | Fidelity National Title Co | |
| Mouras Belton | -- | Fidelity National Title Co | |
| Brasier Nina | -- | Fidelity National Title Co | |
| Brasier Nina | $110,000 | Fidelity National Title Co | |
| Morgan Elizabeth | -- | -- |
Source: Public Records
Mortgage History
| Date | Status | Borrower | Loan Amount |
|---|---|---|---|
| Open | Vasili Ivanovich Lapatski And Raisa Vasilyevn | $414,000 | |
| Closed | Vasili Ivanovich Lapatski And Raisa Vasilyevn | $414,000 | |
| Previous Owner | Rueda Jesus Solis | $79,800 | |
| Previous Owner | Roadrunner Properties Lp | $79,800 | |
| Previous Owner | Roadrunner Properties Lp | $319,200 | |
| Previous Owner | Brasier Nina | $77,000 |
Source: Public Records
Tax History Compared to Growth
Tax History
| Year | Tax Paid | Tax Assessment Tax Assessment Total Assessment is a certain percentage of the fair market value that is determined by local assessors to be the total taxable value of land and additions on the property. | Land | Improvement |
|---|---|---|---|---|
| 2025 | $2,490 | $215,554 | $68,407 | $147,147 |
| 2024 | $2,490 | $211,328 | $67,066 | $144,262 |
| 2023 | $2,507 | $207,185 | $65,751 | $141,434 |
| 2022 | $2,363 | $203,123 | $64,462 | $138,661 |
| 2021 | $2,357 | $199,142 | $63,199 | $135,943 |
| 2020 | $2,337 | $197,101 | $62,551 | $134,550 |
| 2019 | $2,307 | $193,237 | $61,325 | $131,912 |
| 2018 | $2,194 | $189,449 | $60,123 | $129,326 |
| 2017 | $2,250 | $185,736 | $58,945 | $126,791 |
| 2016 | $2,251 | $182,095 | $57,790 | $124,305 |
| 2015 | $2,118 | $179,360 | $56,922 | $122,438 |
| 2014 | $2,159 | $175,847 | $55,807 | $120,040 |
Source: Public Records
Map
Nearby Homes
- 4121 Chesapeake Ln
- 4124 Vicksburg Ln Unit 176
- 4824 Liberty Bell Ln
- 5010 Lorijo Way
- 5020 Valley Forge Ln
- 4202 Ticonderoga Ln
- 5040 Jackson St Unit 169
- 5040 Jackson St Unit 135
- 5040 Jackson St Unit 18
- 5040 Jackson St Unit 48
- 5040 Jackson St Unit 60
- 5040 Jackson St Unit 93
- 5040 Jackson St Unit 91
- 5040 Jackson St Unit 152
- 5064 Valley Forge Ln Unit 25
- 4210 Bunker Hill
- 5252- Jackson St
- 3921 Renick Way
- 5341 Harrison St
- 4959 Clearwood Way
- 4955 Yucca Way
- 4025 Tricia Way
- 4026 Tricia Way
- 4931 Yucca Way
- 4018 Ward Ave
- 4961 Yucca Way
- 4019 Tricia Way
- 4024 Tricia Way
- 4948 Yucca Way
- 4942 Yucca Way
- 4954 Yucca Way
- 4012 Ward Ave
- 4936 Yucca Way
- 4018 Tricia Way
- 4958 Yucca Way
- 4013 Tricia Way
- 4916 Ward Ave
- 4930 Yucca Way
- 4025 Carriebee Ct
- 4962 Yucca Way