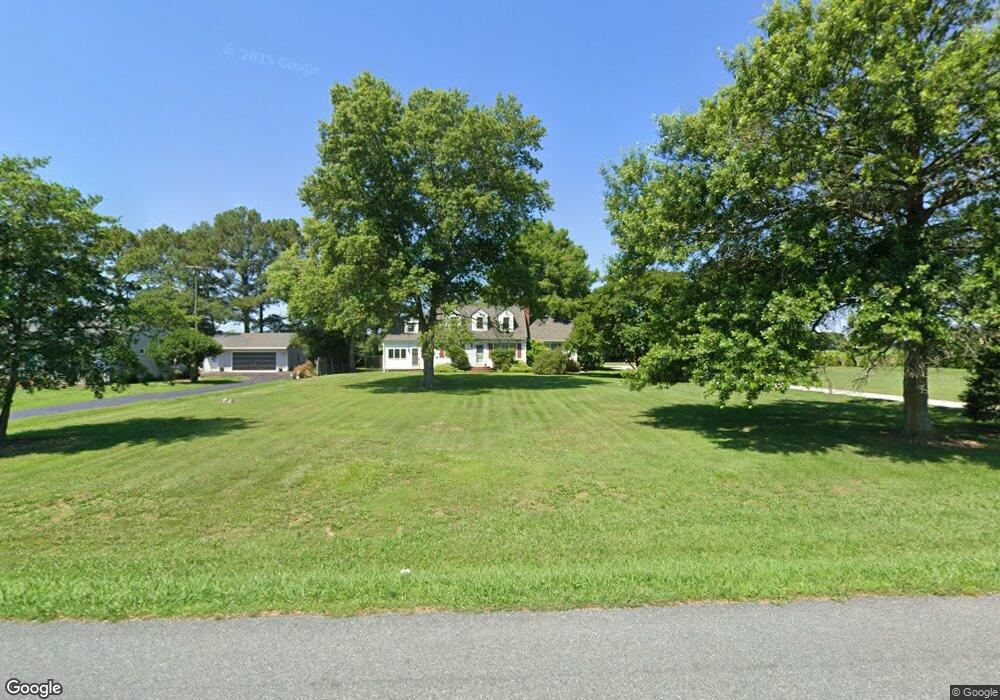
4950 Maple Dam Rd Cambridge, MD 21613
Estimated Value: $173,000 - $425,000
--
Bed
2
Baths
1,898
Sq Ft
$152/Sq Ft
Est. Value
About This Home
This home is located at 4950 Maple Dam Rd, Cambridge, MD 21613 and is currently estimated at $288,457, approximately $151 per square foot. 4950 Maple Dam Rd is a home located in Dorchester County with nearby schools including Maple Elementary School, Mace's Lane Middle School, and Cambridge-South Dorchester High School.
Ownership History
Date
Name
Owned For
Owner Type
Purchase Details
Closed on
Feb 24, 2014
Sold by
Walls Edward L and Walls Amy D
Bought by
Walls Edward L
Current Estimated Value
Home Financials for this Owner
Home Financials are based on the most recent Mortgage that was taken out on this home.
Original Mortgage
$103,209
Outstanding Balance
$30,462
Interest Rate
4.39%
Mortgage Type
New Conventional
Estimated Equity
$257,995
Purchase Details
Closed on
Sep 12, 2003
Sold by
Jordan Stephen J and Jordan Sally A
Bought by
Walls Edward L and Walls Amy D
Purchase Details
Closed on
Feb 18, 1993
Sold by
Peters Donald F and Peters Arlene G
Bought by
Jordan Stephen J and Jordan Sally A
Home Financials for this Owner
Home Financials are based on the most recent Mortgage that was taken out on this home.
Original Mortgage
$103,500
Interest Rate
7.75%
Purchase Details
Closed on
Mar 27, 1985
Sold by
Luthy John F
Bought by
Peters Donald F and Peters Arlene G
Create a Home Valuation Report for This Property
The Home Valuation Report is an in-depth analysis detailing your home's value as well as a comparison with similar homes in the area
Home Values in the Area
Average Home Value in this Area
Purchase History
| Date | Buyer | Sale Price | Title Company |
|---|---|---|---|
| Walls Edward L | -- | National Link | |
| Walls Edward L | $155,000 | -- | |
| Jordan Stephen J | $115,000 | -- | |
| Peters Donald F | $55,000 | -- |
Source: Public Records
Mortgage History
| Date | Status | Borrower | Loan Amount |
|---|---|---|---|
| Open | Walls Edward L | $103,209 | |
| Previous Owner | Jordan Stephen J | $103,500 |
Source: Public Records
Tax History Compared to Growth
Tax History
| Year | Tax Paid | Tax Assessment Tax Assessment Total Assessment is a certain percentage of the fair market value that is determined by local assessors to be the total taxable value of land and additions on the property. | Land | Improvement |
|---|---|---|---|---|
| 2025 | $1,770 | $149,700 | $45,400 | $104,300 |
| 2024 | $1,585 | $143,400 | $0 | $0 |
| 2023 | $1,585 | $137,100 | $0 | $0 |
| 2022 | $1,515 | $130,800 | $45,400 | $85,400 |
| 2021 | $1,443 | $127,567 | $0 | $0 |
| 2020 | $1,443 | $124,333 | $0 | $0 |
| 2019 | $1,407 | $121,100 | $45,400 | $75,700 |
| 2018 | $1,407 | $121,100 | $45,400 | $75,700 |
| 2017 | $1,375 | $121,100 | $0 | $0 |
| 2016 | -- | $123,900 | $0 | $0 |
| 2015 | -- | $123,900 | $0 | $0 |
| 2014 | -- | $123,900 | $0 | $0 |
Source: Public Records
Map
Nearby Homes
- 2614 Brian Cir
- 2631 Rebecca Ln
- 2488 Westwind Blvd Unit TH
- 4736 Egypt Rd
- 2645 Rebecca Ln
- 0 Maple Dam Rd Unit 15924452
- Sika, Whitetail & Tu Church Creek Rd
- 2409 Cambridge Beltway
- 2420 Cambridge Beltway
- 1639 Terrapin Cir
- 0 Woods Rd
- 301 Old Squaw Ct
- 402 Ruddy Duck Ct
- 1606 Osprey Cir
- 2238 Pig Neck Rd
- 0 N S Dailsville Rd
- 405 Osprey Cir
- 112 Mariners Way
- 374 Robbins Farm Rd
- 120 Mariners Way
- 4946 Maple Dam Rd
- 4954 Maple Dam Rd
- 5002 Maple Dam Rd
- 5005 Maple Dam Rd
- 4933 Maple Dam Rd
- 4931 Maple Dam Rd
- 4935 Maple Dam Rd
- 4927 Maple Dam Rd
- 5003 Maple Dam Rd
- 5030 Maple Dam Rd
- 4840 Maple Dam Rd
- 5101 Maple Dam Rd
- 5119 Maple Dam Rd
- 0 Maple Dam Rd Unit DO10121361
- 5123 Maple Dam Rd
- 0 Egypt Rd
- 4825 Maple Dam Rd
- 5125 Maple Dam Rd
- 5122 Maple Dam Rd
- 4793 Maple Dam Rd