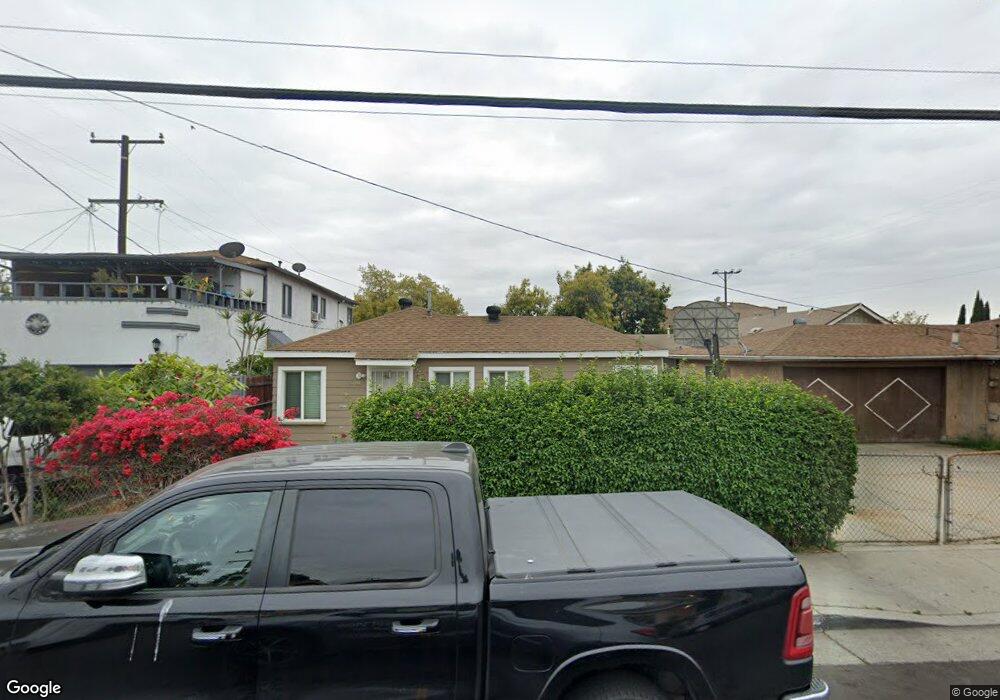
4952 E 6th St Los Angeles, CA 90022
Estimated Value: $690,996 - $788,000
4
Beds
2
Baths
1,696
Sq Ft
$446/Sq Ft
Est. Value
About This Home
This home is located at 4952 E 6th St, Los Angeles, CA 90022 and is currently estimated at $756,749, approximately $446 per square foot. 4952 E 6th St is a home located in Los Angeles County with nearby schools including Fourth Street Primary Center, Fourth Street Elementary School, and James A. Garfield Senior High School.
Ownership History
Date
Name
Owned For
Owner Type
Purchase Details
Closed on
Aug 13, 2024
Sold by
Guzman Oscar Alexander and Guzman Jazmin Beatriz
Bought by
Guzman Living Trust and Guzman
Current Estimated Value
Purchase Details
Closed on
Nov 22, 2023
Sold by
Alcaraz Jesus and Alcaraz Maria De
Bought by
Jesus And Maria Alcaraz Trust and Alcaraz
Purchase Details
Closed on
Aug 21, 2001
Sold by
Alcaraz Jesus
Bought by
Alcaraz Jesus and Alcaraz Maria Delourdes
Purchase Details
Closed on
Jan 30, 2001
Sold by
Alcaraz Maria De Lourdes
Bought by
Alcaraz Jesus
Home Financials for this Owner
Home Financials are based on the most recent Mortgage that was taken out on this home.
Original Mortgage
$132,000
Interest Rate
7.13%
Purchase Details
Closed on
Jan 3, 2001
Sold by
Rodriguez Antonio
Bought by
Alcarez Jesus
Home Financials for this Owner
Home Financials are based on the most recent Mortgage that was taken out on this home.
Original Mortgage
$132,000
Interest Rate
7.13%
Create a Home Valuation Report for This Property
The Home Valuation Report is an in-depth analysis detailing your home's value as well as a comparison with similar homes in the area
Home Values in the Area
Average Home Value in this Area
Purchase History
| Date | Buyer | Sale Price | Title Company |
|---|---|---|---|
| Guzman Living Trust | -- | None Listed On Document | |
| Jesus And Maria Alcaraz Trust | -- | None Listed On Document | |
| Alcaraz Jesus | -- | -- | |
| Alcaraz Jesus | -- | Southland Title Company | |
| Alcarez Jesus | $165,000 | Southland Title Company |
Source: Public Records
Mortgage History
| Date | Status | Borrower | Loan Amount |
|---|---|---|---|
| Previous Owner | Alcarez Jesus | $132,000 |
Source: Public Records
Tax History
| Year | Tax Paid | Tax Assessment Tax Assessment Total Assessment is a certain percentage of the fair market value that is determined by local assessors to be the total taxable value of land and additions on the property. | Land | Improvement |
|---|---|---|---|---|
| 2025 | $4,087 | $248,601 | $88,741 | $159,860 |
| 2024 | $4,087 | $243,727 | $87,001 | $156,726 |
| 2023 | $3,854 | $238,949 | $85,296 | $153,653 |
| 2022 | $3,698 | $234,265 | $83,624 | $150,641 |
| 2021 | $3,649 | $229,673 | $81,985 | $147,688 |
| 2019 | $3,553 | $222,862 | $79,554 | $143,308 |
| 2018 | $3,462 | $218,494 | $77,995 | $140,499 |
| 2016 | $3,313 | $210,012 | $74,967 | $135,045 |
| 2015 | $3,266 | $206,858 | $73,841 | $133,017 |
| 2014 | $3,269 | $202,807 | $72,395 | $130,412 |
Source: Public Records
Map
Nearby Homes
- 4820 Eagle St
- 606 S Kern Ave
- 407 S Vancouver Ave
- 5110 Whittier Blvd
- 404 S Woods Ave
- 531 S Hillview Ave
- 946 S Ferris Ave
- 946 S Vancouver Ave
- 389 Amalia Ave
- 654 Oakford Dr
- 565 Margaret Ave
- 4421 -4423 Floral Dr
- 529 531 S Sydney
- 731 Belden Ave
- 1114 S Kern Ave
- 225 S Kern Ave
- 223 S Kern Ave
- 545 Eastmont Ave
- 1123 S Kern Ave
- 742 Belden Ave
- 601 Fraser Ave
- 613 Fraser Ave
- 4948 E 6th St
- 610 S La Verne Ave
- 617 Fraser Ave
- 612 S La Verne Ave
- 623 Fraser Ave
- 4947 E 6th St
- 620 S La Verne Ave
- 579 Fraser Ave
- 627 Fraser Ave
- 572 S La Verne Ave
- 622 S La Verne Ave
- 573 Fraser Ave
- 629 Fraser Ave
- 569 Fraser Ave
- 568 S La Verne Ave
- 630 S La Verne Ave
- 612 Fraser Ave
- 608 Fraser Ave
Your Personal Tour Guide
Ask me questions while you tour the home.