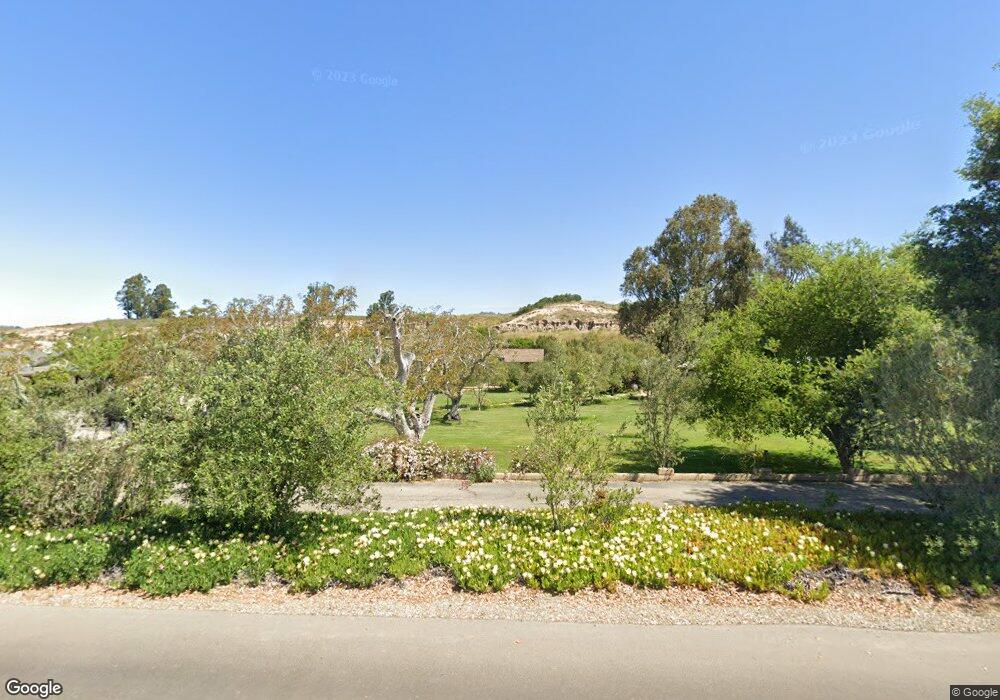
4955 Hapgood Rd Lompoc, CA 93436
Estimated Value: $861,000 - $1,435,000
3
Beds
2
Baths
2,086
Sq Ft
$562/Sq Ft
Est. Value
About This Home
This home is located at 4955 Hapgood Rd, Lompoc, CA 93436 and is currently estimated at $1,172,485, approximately $562 per square foot. 4955 Hapgood Rd is a home located in Santa Barbara County with nearby schools including Arthur Hapgood Elementary School, Lompoc Valley Middle School, and Lompoc High School.
Ownership History
Date
Name
Owned For
Owner Type
Purchase Details
Closed on
Jul 18, 2023
Sold by
Rushing Joseph E
Bought by
Rushing Family Llc
Current Estimated Value
Purchase Details
Closed on
Apr 17, 2015
Sold by
Rushing Sally J
Bought by
Rushing Joseph E
Home Financials for this Owner
Home Financials are based on the most recent Mortgage that was taken out on this home.
Original Mortgage
$230,000
Interest Rate
3.8%
Mortgage Type
Unknown
Purchase Details
Closed on
Apr 15, 2015
Sold by
Pass Rosalind R
Bought by
Rushing Joseph E
Home Financials for this Owner
Home Financials are based on the most recent Mortgage that was taken out on this home.
Original Mortgage
$230,000
Interest Rate
3.8%
Mortgage Type
Unknown
Purchase Details
Closed on
Dec 30, 1993
Sold by
Reed Dorothy M
Bought by
Reed Dorothy Marie and Dorothy Marie Reed Trust
Purchase Details
Closed on
Dec 29, 1993
Sold by
Collar Glenn E
Bought by
Collar Glenn E
Create a Home Valuation Report for This Property
The Home Valuation Report is an in-depth analysis detailing your home's value as well as a comparison with similar homes in the area
Purchase History
| Date | Buyer | Sale Price | Title Company |
|---|---|---|---|
| Rushing Family Llc | -- | None Listed On Document | |
| Rushing Joseph E | -- | North American Title Company | |
| Rushing Joseph E | $525,000 | North American Title Company | |
| Reed Dorothy Marie | -- | -- | |
| Collar Glenn E | -- | -- |
Source: Public Records
Mortgage History
| Date | Status | Borrower | Loan Amount |
|---|---|---|---|
| Previous Owner | Rushing Joseph E | $230,000 |
Source: Public Records
Tax History
| Year | Tax Paid | Tax Assessment Tax Assessment Total Assessment is a certain percentage of the fair market value that is determined by local assessors to be the total taxable value of land and additions on the property. | Land | Improvement |
|---|---|---|---|---|
| 2025 | $6,819 | $630,963 | $480,737 | $150,226 |
| 2023 | $6,819 | $606,464 | $462,070 | $144,394 |
| 2022 | $6,705 | $594,573 | $453,010 | $141,563 |
| 2021 | $6,783 | $582,916 | $444,128 | $138,788 |
| 2020 | $6,709 | $576,940 | $439,575 | $137,365 |
| 2019 | $6,601 | $565,628 | $430,956 | $134,672 |
| 2018 | $6,501 | $554,538 | $422,506 | $132,032 |
| 2017 | $6,383 | $543,666 | $414,222 | $129,444 |
| 2016 | $6,269 | $533,006 | $406,100 | $126,906 |
| 2015 | $1,355 | $120,375 | $39,549 | $80,826 |
| 2014 | -- | $118,018 | $38,775 | $79,243 |
Source: Public Records
Map
Nearby Homes
- 1066 Drum Canyon Rd
- 4375 Sweeney Rd
- 3145 Ca-246
- 2755 Purisima Rd
- 11 Mail Rd
- 0000 Sweeney Rd
- 1722 River Vista Way
- 1990 Tularosa Road #4
- 2140 Sweeney Rd
- E Highway 246
- 1588 Calle Portos
- 3578 Via Lato
- 493 Live Oak Rd
- 1704 E Nectarine Ave
- 1735 River Vista Way
- 1725 Autumn Sage Place
- 1741 River Vista Way
- 1744 River Vista Way
- 1742 River Vista Way
- 1740 River Vista Way
- 4925 Hapgood Rd
- 4905 Hapgood Rd
- 4875 Hapgood Rd
- 4835 E Highway 246
- 4892 Hapgood Rd
- 5180 E Highway 246
- 5180 E Highway 246
- 5180 E Hwy 246
- 0000 Turner Vineyard
- 4811 E Rt#-246 Buellton Lompoc Rd
- 5200 E Highway 246
- 4811 E Highway 246
- 4380 E Highway 246
- 5311 Campbell Rd
- 4811 California 246 Unit E
- 4811 E Highway 246
- 4811 E Highway 246
- 4811 E Hwy 246
- 4811 E Hwy 246
- 4805 E Highway 246
Your Personal Tour Guide
Ask me questions while you tour the home.