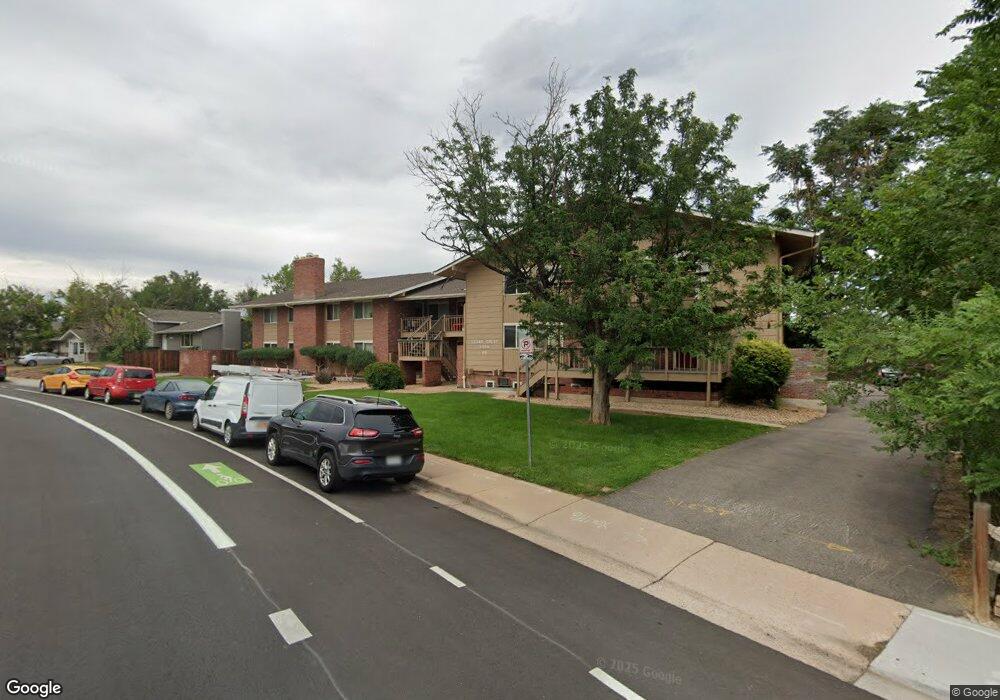
4955 Moorhead Ave Unit 12 Boulder, CO 80305
South Boulder NeighborhoodEstimated Value: $335,000 - $361,000
2
Beds
1
Bath
792
Sq Ft
$435/Sq Ft
Est. Value
About This Home
This home is located at 4955 Moorhead Ave Unit 12, Boulder, CO 80305 and is currently estimated at $344,892, approximately $435 per square foot. 4955 Moorhead Ave Unit 12 is a home located in Boulder County with nearby schools including Creekside Elementary School, Manhattan Middle School of the Arts & Academics, and Fairview High School.
Ownership History
Date
Name
Owned For
Owner Type
Purchase Details
Closed on
Jun 28, 2022
Sold by
Cedar Crest Unit I8 Llc
Bought by
Le Hai T and Uag Soua H
Current Estimated Value
Home Financials for this Owner
Home Financials are based on the most recent Mortgage that was taken out on this home.
Original Mortgage
$260,000
Outstanding Balance
$234,247
Interest Rate
5.09%
Mortgage Type
New Conventional
Estimated Equity
$110,646
Purchase Details
Closed on
Feb 14, 2005
Sold by
Spicer Charles and Spicer Linnea
Bought by
Cedar Crest Unit 18 Llc
Purchase Details
Closed on
Aug 29, 2003
Sold by
Johnson Matt
Bought by
Johnson Matthew P
Home Financials for this Owner
Home Financials are based on the most recent Mortgage that was taken out on this home.
Original Mortgage
$57,500
Interest Rate
2.87%
Mortgage Type
Unknown
Create a Home Valuation Report for This Property
The Home Valuation Report is an in-depth analysis detailing your home's value as well as a comparison with similar homes in the area
Home Values in the Area
Average Home Value in this Area
Purchase History
| Date | Buyer | Sale Price | Title Company |
|---|---|---|---|
| Le Hai T | $360,000 | None Listed On Document | |
| Cedar Crest Unit 18 Llc | -- | None Available | |
| Johnson Matthew P | -- | First American |
Source: Public Records
Mortgage History
| Date | Status | Borrower | Loan Amount |
|---|---|---|---|
| Open | Le Hai T | $260,000 | |
| Previous Owner | Johnson Matthew P | $57,500 |
Source: Public Records
Tax History Compared to Growth
Tax History
| Year | Tax Paid | Tax Assessment Tax Assessment Total Assessment is a certain percentage of the fair market value that is determined by local assessors to be the total taxable value of land and additions on the property. | Land | Improvement |
|---|---|---|---|---|
| 2025 | $1,583 | $20,400 | -- | $20,400 |
| 2024 | $1,583 | $20,400 | -- | $20,400 |
| 2023 | $1,631 | $18,012 | -- | $21,697 |
| 2022 | $2,085 | $21,649 | $0 | $21,649 |
| 2021 | $1,992 | $22,272 | $0 | $22,272 |
| 2020 | $1,487 | $17,081 | $0 | $17,081 |
| 2019 | $1,464 | $17,081 | $0 | $17,081 |
| 2018 | $1,225 | $14,126 | $0 | $14,126 |
| 2017 | $1,186 | $15,618 | $0 | $15,618 |
| 2016 | $930 | $10,746 | $0 | $10,746 |
| 2015 | $881 | $9,831 | $0 | $9,831 |
| 2014 | $845 | $9,831 | $0 | $9,831 |
Source: Public Records
Map
Nearby Homes
- 15 Pawnee Dr
- 611 Tantra Dr
- 4255 Apache Rd
- 4293 Graham Ct
- 4763 Tantra Dr Unit B
- 750 W Moorhead Cir Unit A
- 800 W Moorhead Cir Unit E
- 850 W Moorhead Cir Unit 3L
- 860 W Moorhead Cir Unit I
- 860 W Moorhead Cir Unit 2K
- 860 W Moorhead Cir Unit 2H
- 725 S 45th St
- 33 S Boulder Cir Unit 306
- 20 S Boulder Cir Unit 2312
- 20 S Boulder Cir Unit 2314
- 20 S Boulder Cir Unit 2109
- 450 S 41st St
- 450 S 40th St
- 4733 W Moorhead Cir
- 1019 Tantra Park Cir
- 4955 Moorhead Ave Unit 10
- 4955 Moorhead Ave Unit 11
- 4955 Moorhead Ave Unit 18
- 4955 Moorhead Ave Unit 17
- 4955 Moorhead Ave Unit 16
- 4955 Moorhead Ave Unit 15
- 4955 Moorhead Ave Unit 14
- 4955 Moorhead Ave Unit 13
- 4955 Moorhead Ave Unit 1
- 4955 Moorhead Ave Unit 9
- 4955 Moorhead Ave Unit 8
- 4955 Moorhead Ave Unit 3
- 4955 Moorhead Ave Unit 2
- 4955 Moorhead Ave Unit 7
- 4955 Moorhead Ave Unit 6
- 4955 Moorhead Ave Unit 5
- 4955 Moorhead Ave Unit 4
- 4955 Moorhead Ave Unit D
- 4955 Moorhead Ave Unit C
- 4955 Moorhead Ave Unit B