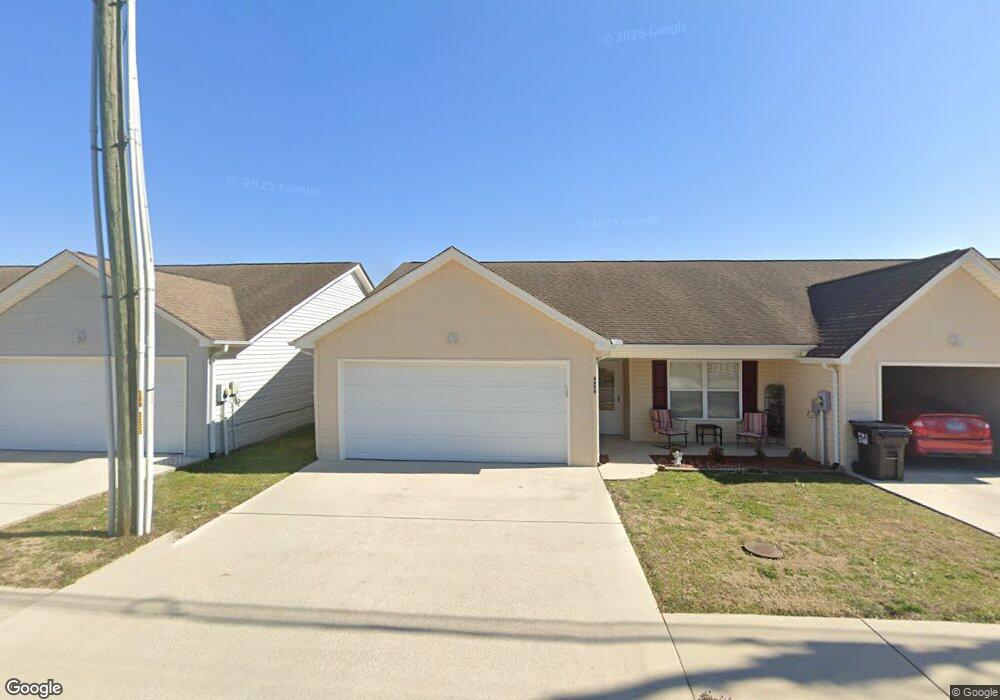
4956 W Valley Rd Dunlap, TN 37327
Estimated Value: $196,000 - $212,000
3
Beds
2
Baths
1,252
Sq Ft
$163/Sq Ft
Est. Value
About This Home
This home is located at 4956 W Valley Rd, Dunlap, TN 37327 and is currently estimated at $204,695, approximately $163 per square foot. 4956 W Valley Rd is a home located in Sequatchie County with nearby schools including Griffith Elementary School, Sequatchie County Middle School, and Sequatchie County High School.
Ownership History
Date
Name
Owned For
Owner Type
Purchase Details
Closed on
Feb 16, 2022
Sold by
Serenity Pointe Inc
Bought by
Turner Charles
Current Estimated Value
Purchase Details
Closed on
Nov 24, 2021
Sold by
Land George D and Austin Thomas K
Bought by
West Point Aquatics Llc
Purchase Details
Closed on
Jan 11, 2010
Sold by
Cornerstone Community Bank
Bought by
Serenity Pointe Inc
Purchase Details
Closed on
May 15, 2009
Bought by
Cornerstone Community Bank
Purchase Details
Closed on
Jun 30, 2006
Bought by
Dowlen Construction Llc % Michael A Dowlen
Purchase Details
Closed on
Feb 7, 2001
Bought by
Green Oaks Llc % Michael A Dowlen
Purchase Details
Closed on
Apr 28, 1997
Purchase Details
Closed on
Sep 16, 1987
Bought by
Wife Lofty W and Wife Hazel
Create a Home Valuation Report for This Property
The Home Valuation Report is an in-depth analysis detailing your home's value as well as a comparison with similar homes in the area
Home Values in the Area
Average Home Value in this Area
Purchase History
| Date | Buyer | Sale Price | Title Company |
|---|---|---|---|
| Turner Charles | $134,000 | None Listed On Document | |
| West Point Aquatics Llc | $400,000 | Reliance Title Agency Inc | |
| Serenity Pointe Inc | $92,000 | -- | |
| Cornerstone Community Bank | $800,000 | -- | |
| Dowlen Construction Llc % Michael A Dowlen | -- | -- | |
| Green Oaks Llc % Michael A Dowlen | $275,000 | -- | |
| -- | $108,200 | -- | |
| Wife Lofty W | $34,500 | -- |
Source: Public Records
Tax History Compared to Growth
Tax History
| Year | Tax Paid | Tax Assessment Tax Assessment Total Assessment is a certain percentage of the fair market value that is determined by local assessors to be the total taxable value of land and additions on the property. | Land | Improvement |
|---|---|---|---|---|
| 2025 | $937 | $38,800 | $0 | $0 |
| 2024 | $937 | $38,800 | $3,000 | $35,800 |
| 2023 | $937 | $38,800 | $3,000 | $35,800 |
| 2022 | $819 | $24,700 | $1,925 | $22,775 |
| 2021 | $807 | $24,700 | $1,925 | $22,775 |
| 2020 | $807 | $24,700 | $1,925 | $22,775 |
| 2019 | $807 | $24,700 | $1,925 | $22,775 |
| 2018 | $798 | $24,700 | $1,925 | $22,775 |
| 2017 | $789 | $24,700 | $1,925 | $22,775 |
| 2016 | $822 | $24,700 | $1,925 | $22,775 |
| 2015 | $823 | $24,700 | $1,925 | $22,775 |
| 2014 | $815 | $24,475 | $1,925 | $22,550 |
Source: Public Records
Map
Nearby Homes
- 88 Clover Dale Rd S
- 89 Clover Dale Rd S
- 43 John Burch Rd W
- 33 John Burch Rd W
- 0 John Burch Rd Unit RTC2705187
- 0 John Burch Rd Unit A 1395827
- 94 Galloway Airport Rd
- 108 Galloway Airport Rd
- 132 Galloway Airport Rd
- 35 Hummingbird Ln
- 74 Hardin Rd
- 0 Treeline Dr Unit 1510685
- 0 Treeline Dr Unit RTC2815537
- 0 Treeline Dr Unit 1510684
- 0 Treeline Dr Unit RTC2815536
- 5 Treeline Dr
- 4 Treeline Dr
- 0 Grandview Dr Unit 1523011
- 919 John Burch Rd
- 0 Hardin Rd Unit 1523572
- 4950 W Valley Rd
- 4964 W Valley Rd
- 4963 W Valley Rd
- 4970 W Valley Rd
- 4936 W Valley Rd
- 4976 W Valley Rd
- 4932 W Valley Rd
- 4926 W Valley Rd
- 4990 W Valley Rd
- 4921 W Valley Rd
- 4947 W Valley Rd
- 4996 W Valley Rd
- 5004 W Valley Rd
- 5010 W Valley Rd
- 24 Charlie Stewart Rd
- 5016 W Valley Rd
- 5022 W Valley Rd
- 5028 W Valley Rd
- 5032 W Valley Rd
- 5040 W Valley Rd