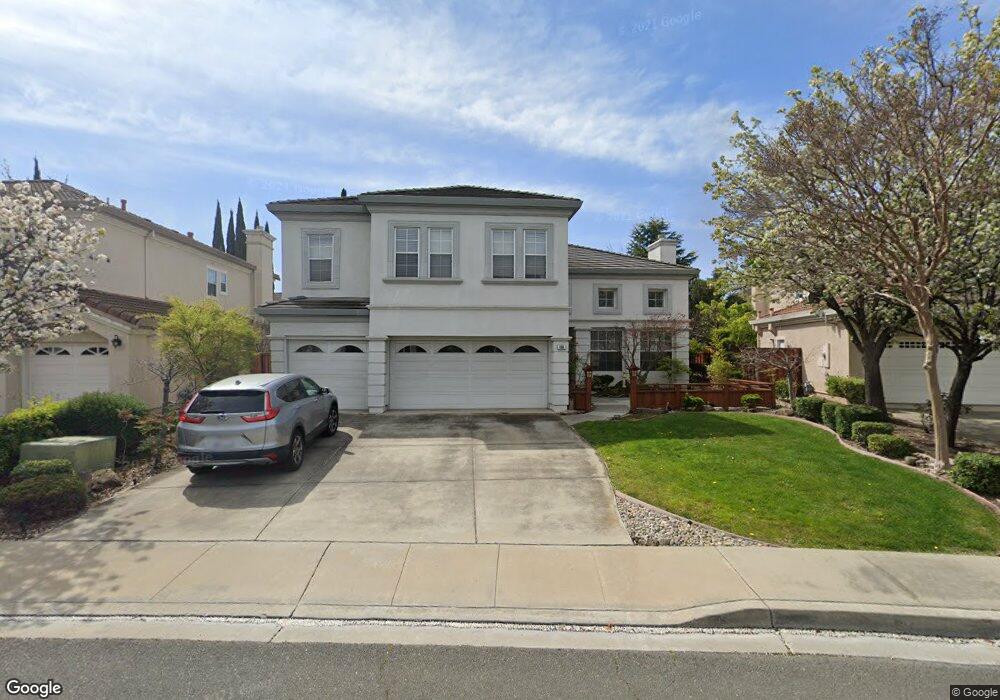
496 Loch Lomond Ct Milpitas, CA 95035
Estimated Value: $2,596,000 - $3,088,000
5
Beds
3
Baths
3,118
Sq Ft
$896/Sq Ft
Est. Value
About This Home
This home is located at 496 Loch Lomond Ct, Milpitas, CA 95035 and is currently estimated at $2,794,351, approximately $896 per square foot. 496 Loch Lomond Ct is a home located in Santa Clara County with nearby schools including Curtner Elementary School, Thomas Russell Middle School, and Milpitas High School.
Ownership History
Date
Name
Owned For
Owner Type
Purchase Details
Closed on
Feb 12, 1999
Sold by
Kusuma Josef Edhy and Kartawidjaja Liliana
Bought by
Nguyen John and Nguyen Lynn B
Current Estimated Value
Home Financials for this Owner
Home Financials are based on the most recent Mortgage that was taken out on this home.
Original Mortgage
$450,000
Outstanding Balance
$106,878
Interest Rate
6.78%
Mortgage Type
Stand Alone First
Estimated Equity
$2,687,473
Purchase Details
Closed on
Jul 25, 1997
Sold by
Inc Shapell Industries Of Northern Cali
Bought by
Kusuma Josef Edhy and Kartawidjaja Liliana
Home Financials for this Owner
Home Financials are based on the most recent Mortgage that was taken out on this home.
Original Mortgage
$304,900
Interest Rate
7.75%
Create a Home Valuation Report for This Property
The Home Valuation Report is an in-depth analysis detailing your home's value as well as a comparison with similar homes in the area
Home Values in the Area
Average Home Value in this Area
Purchase History
| Date | Buyer | Sale Price | Title Company |
|---|---|---|---|
| Nguyen John | $665,000 | Commonwealth Land Title Co | |
| Kusuma Josef Edhy | $505,000 | First American Title Guarant |
Source: Public Records
Mortgage History
| Date | Status | Borrower | Loan Amount |
|---|---|---|---|
| Open | Nguyen John | $450,000 | |
| Previous Owner | Kusuma Josef Edhy | $304,900 |
Source: Public Records
Tax History Compared to Growth
Tax History
| Year | Tax Paid | Tax Assessment Tax Assessment Total Assessment is a certain percentage of the fair market value that is determined by local assessors to be the total taxable value of land and additions on the property. | Land | Improvement |
|---|---|---|---|---|
| 2025 | $11,870 | $1,042,511 | $470,304 | $572,207 |
| 2024 | $11,870 | $1,022,071 | $461,083 | $560,988 |
| 2023 | $11,832 | $1,002,032 | $452,043 | $549,989 |
| 2022 | $11,782 | $982,385 | $443,180 | $539,205 |
| 2021 | $11,610 | $963,124 | $434,491 | $528,633 |
| 2020 | $11,407 | $953,249 | $430,036 | $523,213 |
| 2019 | $11,275 | $934,558 | $421,604 | $512,954 |
| 2018 | $10,704 | $916,235 | $413,338 | $502,897 |
| 2017 | $10,565 | $898,271 | $405,234 | $493,037 |
| 2016 | $10,138 | $880,659 | $397,289 | $483,370 |
| 2015 | $10,034 | $867,432 | $391,322 | $476,110 |
| 2014 | $9,770 | $850,441 | $383,657 | $466,784 |
Source: Public Records
Map
Nearby Homes
- 800 Los Positos Dr
- 7280 Marylinn Dr
- 0 Railroad Ave
- 350 Hearst Dr
- 7 Crystal Ct
- 1000 Jacklin Rd
- 253 Park Hill Dr
- 207 Redwood Ave
- 99 Jacklin Ct
- 773 Heflin St
- 1084 N Hillview Dr
- 50 Serra Way
- 479 Chestnut Ave
- 559 Walnut Dr
- 521 Topham Ct
- 1200 N Abbott Ave Unit 200
- 468 Glenmoor Cir
- 1048 N Abbott Ave
- 182 Rose Dr
- 386 Heath St
- 506 Loch Lomond Ct
- 486 Loch Lomond Ct
- 497 Paseo Refugio
- 489 Paseo Refugio
- 516 Loch Lomond Ct
- 505 Paseo Refugio
- 476 Loch Lomond Ct
- 481 Paseo Refugio
- 505 Loch Lomond Ct
- 513 Paseo Refugio
- 495 Loch Lomond Ct
- 526 Loch Lomond Ct
- 473 Paseo Refugio
- 466 Loch Lomond Ct
- 515 Loch Lomond Ct
- 521 Paseo Refugio
- 465 Paseo Refugio
- 525 Loch Lomond Ct
- 536 Loch Lomond Ct
- 456 Loch Lomond Ct