
Seller's Agent in 2025
Cody Fry
Better Homes and Gardens R.E.
(402) 800-6300
3 in this area
44 Total Sales
Estimated Value: $190,000 - $216,000
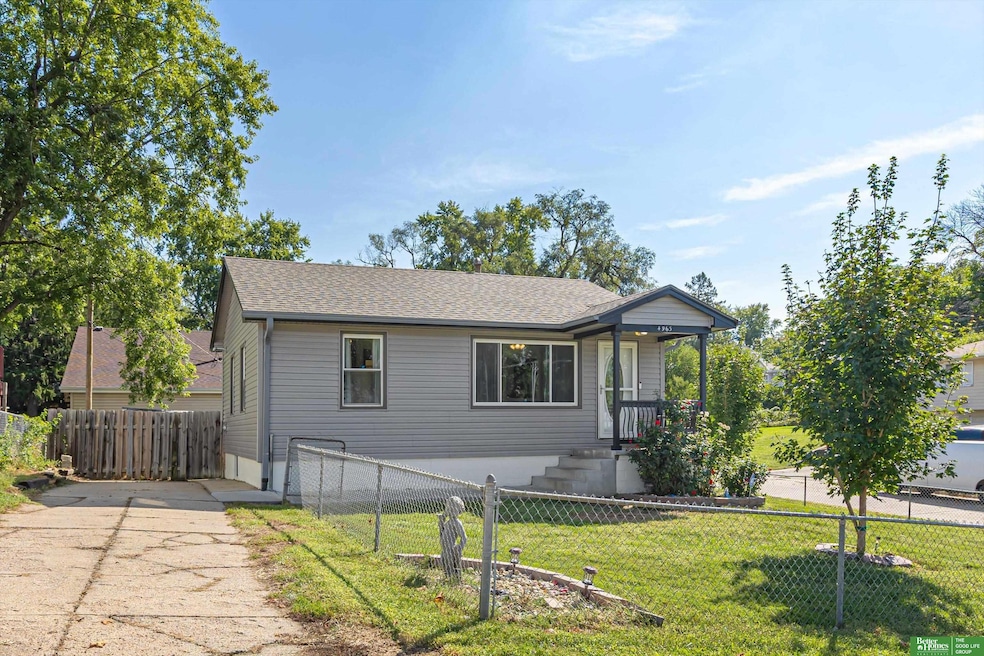
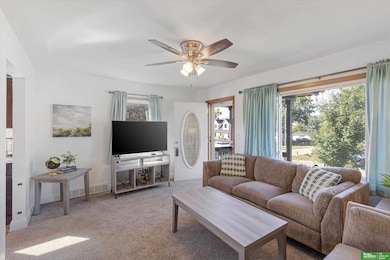
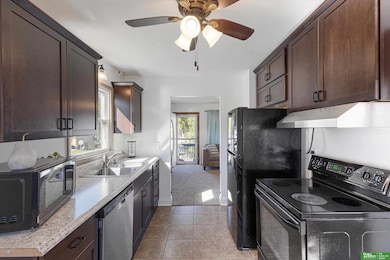
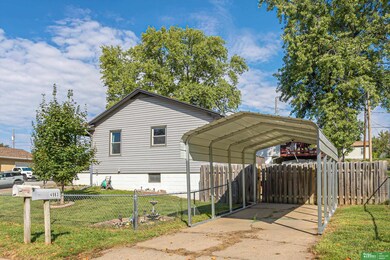
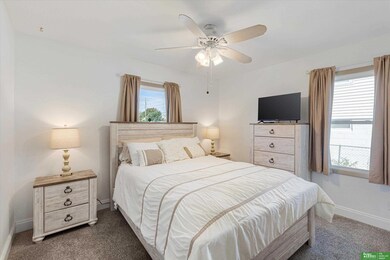
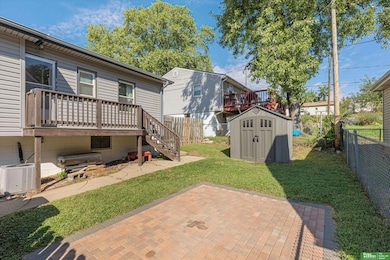
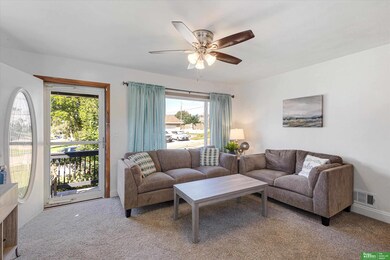
This charming 2 bedroom, 2 bathroom ranch-style home has been lovingly updated and is move-in ready for its next owner. Step inside to find a bright, inviting layout with thoughtful updates throughout, including a finished basement with a versatile flex room—perfect for a home office or workout area. The kitchen comes complete with all appliances, and you’ll love knowing the refrigerator, dishwasher, washer, and dryer have all been recently replaced. An advanced air purifier system with an air scrubber (installed May 2025) provides peace of mind and added comfort year-round. Outside, enjoy your fully fenced yard with plenty of room for gatherings, pets, or gardening. The property offers two separate driveways—ideal for extra parking—with one featuring a covered carport. This home has already been pre-inspected by Corspect, giving you added confidence in your purchase.
Last Agent to Sell the Property
Better Homes and Gardens R.E. License #20210442 Listed on: 09/25/2025
We collect this data history from publicly available records. To have your information removed, we recommend requesting removal directly through your county’s website.
We collect this data history from publicly available records. To have your information removed, we recommend requesting removal directly through your county’s website.
| Date | Buyer | Sale Price | Title Company |
|---|---|---|---|
| $200,000 | Unity Title | ||
| -- | Rts Title | ||
| $90,000 | -- |
We collect this data history from publicly available records. To have your information removed, we recommend requesting removal directly through your county’s website.
| Date | Status | Borrower | Loan Amount |
|---|---|---|---|
| Open | $6,000 | ||
| Open | $193,150 |
We collect this data history from publicly available records. To have your information removed, we recommend requesting removal directly through your county’s website.
| Date | Event | Price | List to Sale | Price per Sq Ft | Prior Sale |
|---|---|---|---|---|---|
| 11/20/2025 11/20/25 | Sold | $200,000 | +0.5% | $164 / Sq Ft | |
| 09/27/2025 09/27/25 | Pending | -- | -- | -- | |
| 09/25/2025 09/25/25 | For Sale | $199,000 | +36.3% | $164 / Sq Ft | |
| 09/16/2022 09/16/22 | Sold | $146,000 | 0.0% | $140 / Sq Ft | View Prior Sale |
| 08/28/2022 08/28/22 | Pending | -- | -- | -- | |
| 08/28/2022 08/28/22 | For Sale | $146,000 | -- | $140 / Sq Ft |
We collect this data history from publicly available records. To have your information removed, we recommend requesting removal directly through your county’s website.
| Year | Tax Paid | Tax Assessment Tax Assessment Total Assessment is a certain percentage of the fair market value that is determined by local assessors to be the total taxable value of land and additions on the property. | Land | Improvement |
|---|---|---|---|---|
| 2025 | $2,254 | $135,300 | $9,800 | $125,500 |
| 2024 | $2,388 | $135,300 | $9,800 | $125,500 |
| 2023 | $2,388 | $113,200 | $9,800 | $103,400 |
| 2022 | $2,455 | $115,000 | $11,600 | $103,400 |
| 2021 | $2,225 | $105,100 | $11,600 | $93,500 |
| 2020 | $2,250 | $105,100 | $11,600 | $93,500 |
| 2019 | $2,053 | $95,600 | $11,600 | $84,000 |
| 2018 | $1,621 | $75,400 | $11,600 | $63,800 |
| 2017 | $1,193 | $55,200 | $5,400 | $49,800 |
| 2016 | $1,184 | $55,200 | $5,400 | $49,800 |
| 2015 | $1,169 | $55,200 | $5,400 | $49,800 |
| 2014 | $1,169 | $55,200 | $5,400 | $49,800 |
Seller's Agent in 2025
Cody Fry
Better Homes and Gardens R.E.
(402) 800-6300
3 in this area
44 Total Sales
Buyer's Agent in 2025
Ebony Turner
NP Dodge Real Estate Sales, Inc.
(402) 779-1630
1 in this area
23 Total Sales
Buyer's Agent in 2022
Tiffany Harvat
Real Broker NE, LLC
(712) 898-5296
2 in this area
40 Total Sales
Source: Great Plains Regional MLS
MLS Number: 22527534
APN: 2056-0001-24
Disclaimer: Certain information contained herein is derived from information provided by parties other than Homes.com. All information provided is deemed reliable, but is not guaranteed to be accurate and should be independently verified.
![]() Listing information is provided by Participants of the Great Plains Regional Multiple Listing Service Inc.
Listing information is provided by Participants of the Great Plains Regional Multiple Listing Service Inc.
IDX information is provided exclusively for personal, non-commercial use, and may not be used for any purpose other than to identify prospective properties consumers may be interested in purchasing.
Information is deemed reliable but not guaranteed.
Copyright 2026, Great Plains Regional MLS LLC
Ask me questions while you tour the home.