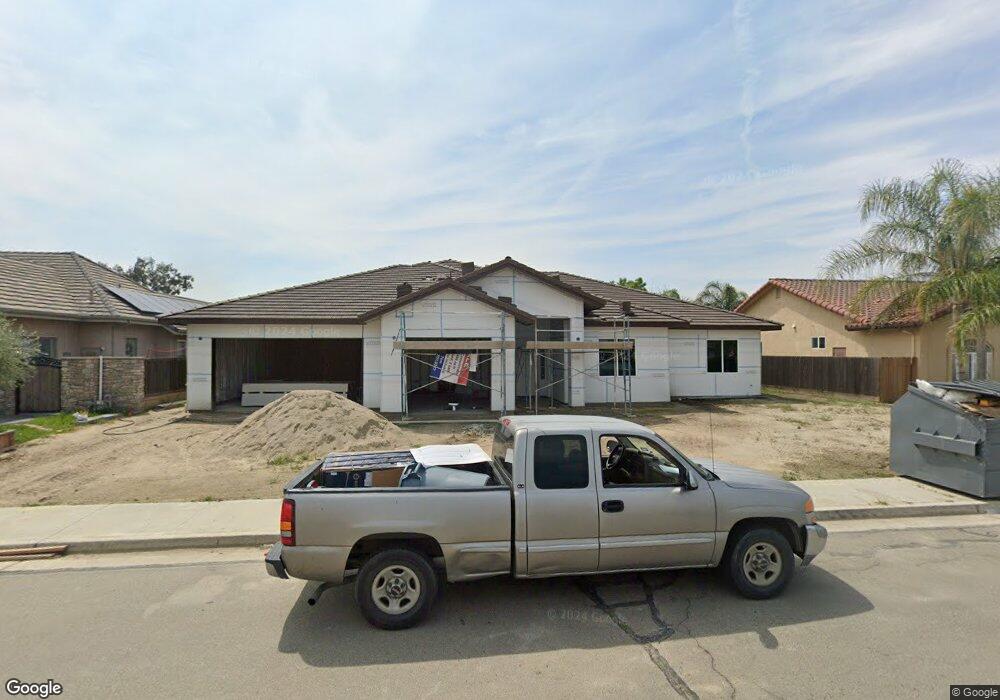
497 E Capistrano St Hanford, CA 93230
Estimated Value: $520,171 - $609,000
Studio
--
Bath
10,441
Sq Ft
$54/Sq Ft
Est. Value
About This Home
This home is located at 497 E Capistrano St, Hanford, CA 93230 and is currently estimated at $562,043, approximately $53 per square foot. 497 E Capistrano St is a home located in Kings County with nearby schools including Hanford West High School, Kings River-Hardwick Elementary School, and Frontier Elementary School.
Ownership History
Date
Name
Owned For
Owner Type
Purchase Details
Closed on
Jul 17, 2010
Sold by
Bank Of The Sierra
Bought by
Oasis Valley No 1 Llc
Current Estimated Value
Purchase Details
Closed on
Jun 11, 2009
Sold by
Rutter Norm and Rutter Sandy
Bought by
Bank Of The Sierra
Purchase Details
Closed on
Apr 4, 2007
Sold by
Norm & Sandy Rutter Inc
Bought by
Rutter Norm and Rutter Sandy
Home Financials for this Owner
Home Financials are based on the most recent Mortgage that was taken out on this home.
Original Mortgage
$103,000
Interest Rate
6.13%
Mortgage Type
Purchase Money Mortgage
Purchase Details
Closed on
Feb 21, 2007
Sold by
Mission Park Inc
Bought by
Norm & Sandy Rutter Inc
Home Financials for this Owner
Home Financials are based on the most recent Mortgage that was taken out on this home.
Original Mortgage
$103,000
Interest Rate
6.13%
Mortgage Type
Purchase Money Mortgage
Create a Home Valuation Report for This Property
The Home Valuation Report is an in-depth analysis detailing your home's value as well as a comparison with similar homes in the area
Home Values in the Area
Average Home Value in this Area
Purchase History
| Date | Buyer | Sale Price | Title Company |
|---|---|---|---|
| Oasis Valley No 1 Llc | $73,000 | Chicago Title Company | |
| Bank Of The Sierra | $55,250 | First American Title Company | |
| Rutter Norm | -- | Financial Title Company | |
| Norm & Sandy Rutter Inc | -- | None Available |
Source: Public Records
Mortgage History
| Date | Status | Borrower | Loan Amount |
|---|---|---|---|
| Previous Owner | Rutter Norm | $103,000 |
Source: Public Records
Tax History
| Year | Tax Paid | Tax Assessment Tax Assessment Total Assessment is a certain percentage of the fair market value that is determined by local assessors to be the total taxable value of land and additions on the property. | Land | Improvement |
|---|---|---|---|---|
| 2025 | $763 | $475,058 | $64,058 | $411,000 |
| 2023 | $763 | $61,571 | $61,571 | -- |
| 2022 | $742 | $60,364 | $60,364 | $0 |
| 2021 | $730 | $59,181 | $59,181 | $0 |
| 2020 | $781 | $58,574 | $58,574 | $0 |
| 2019 | $766 | $57,425 | $57,425 | $0 |
| 2018 | $716 | $56,299 | $56,299 | $0 |
| 2017 | $702 | $55,195 | $55,195 | $0 |
| 2016 | $668 | $54,113 | $54,113 | $0 |
| 2015 | $650 | $53,300 | $53,300 | $0 |
| 2014 | $654 | $52,256 | $52,256 | $0 |
Source: Public Records
Map
Nearby Homes
- 0 Flint Ave
- 3178 Hickory Ct
- 297 W Harold Griswold Way
- 6505 10th Ave
- 3026 Sage Ct
- 2710 Aspen St
- 388 Timberline Ct
- 950 Cedarwood St
- 230 W Ash Ave
- 974 Cedarwood St
- 982 Cedarwood St
- 2403 Cherrywood Ct
- 2411 Cottonwood Dr
- 2335 N Douty St
- 903 W Sandstone Ct Unit 1
- 120 W Magnolia Ave
- 180 W Magnolia Ave
- 3262 Morning Dove Ln
- 165 W Magnolia Ave
- 2204 Fairmont Dr
- 481 E Capistrano St
- 552 Imperial Dr
- 568 Imperial Dr
- 535 E Capistrano St
- 536 Imperial Dr
- 584 Imperial Dr
- 3317 N Bautista Ave
- 520 Imperial Dr
- 470 E Capistrano St
- 3320 Mission Dr
- 3337 N Bautista Ave
- 600 Imperial Dr
- 3338 N Bautista Ave
- 551 Imperial Dr
- 567 Imperial Dr
- 0 E Capistrano St
- 535 Imperial Dr
- 583 Imperial Dr
- 519 Imperial Dr
- 614 Imperial Dr
Your Personal Tour Guide
Ask me questions while you tour the home.