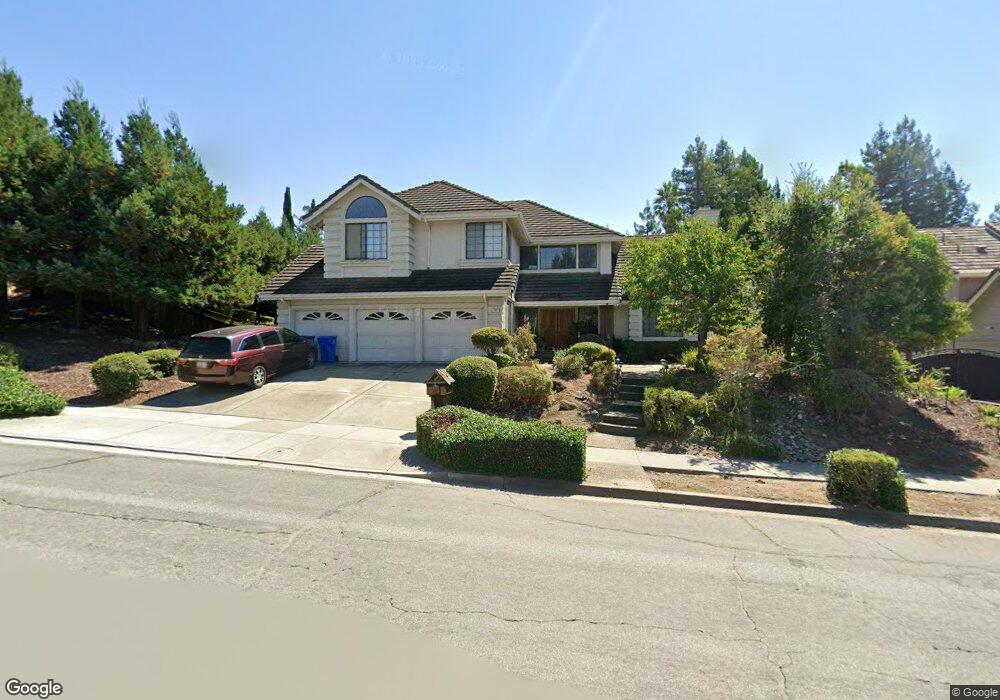
497 Hunter Ln Fremont, CA 94539
Weibel NeighborhoodEstimated Value: $2,890,000 - $3,963,000
5
Beds
3
Baths
3,200
Sq Ft
$1,109/Sq Ft
Est. Value
About This Home
This home is located at 497 Hunter Ln, Fremont, CA 94539 and is currently estimated at $3,548,634, approximately $1,108 per square foot. 497 Hunter Ln is a home located in Alameda County with nearby schools including Mission San Jose Elementary School, William Hopkins Junior High School, and Mission San Jose High School.
Ownership History
Date
Name
Owned For
Owner Type
Purchase Details
Closed on
Sep 19, 2024
Sold by
Liu Taylor Daniel and Liu Teresa Li
Bought by
Taylor Li Family Trust and Taylor
Current Estimated Value
Create a Home Valuation Report for This Property
The Home Valuation Report is an in-depth analysis detailing your home's value as well as a comparison with similar homes in the area
Home Values in the Area
Average Home Value in this Area
Purchase History
| Date | Buyer | Sale Price | Title Company |
|---|---|---|---|
| Taylor Li Family Trust | -- | None Listed On Document | |
| Taylor Li Family Trust | -- | None Listed On Document |
Source: Public Records
Tax History Compared to Growth
Tax History
| Year | Tax Paid | Tax Assessment Tax Assessment Total Assessment is a certain percentage of the fair market value that is determined by local assessors to be the total taxable value of land and additions on the property. | Land | Improvement |
|---|---|---|---|---|
| 2025 | $11,035 | $919,281 | $277,884 | $648,397 |
| 2024 | $11,035 | $901,121 | $272,436 | $635,685 |
| 2023 | $10,741 | $890,317 | $267,095 | $623,222 |
| 2022 | $10,604 | $865,860 | $261,858 | $611,002 |
| 2021 | $10,343 | $848,747 | $256,724 | $599,023 |
| 2020 | $10,381 | $846,973 | $254,092 | $592,881 |
| 2019 | $10,261 | $830,367 | $249,110 | $581,257 |
| 2018 | $10,061 | $814,087 | $244,226 | $569,861 |
| 2017 | $9,809 | $798,130 | $239,439 | $558,691 |
| 2016 | $9,643 | $782,483 | $234,745 | $547,738 |
| 2015 | $9,516 | $770,733 | $231,220 | $539,513 |
| 2014 | $9,354 | $755,636 | $226,691 | $528,945 |
Source: Public Records
Map
Nearby Homes
- 44423 View Point Cir
- 379 Felipe Common
- 44989 Vista Del Sol
- 42099 Vinha Way
- 646 Bella Vista Ct
- 483 Becado Place
- 43547 Ellsworth St
- 1910 Vinehill Cir
- 43382 Bryant St
- 341 Dana St
- 43555 Puesta Del Sol
- 905 Glenhill Dr
- 44916 Winding Ln
- 43150 Starr St
- 138 Telles Ln
- 6700 Mill Creek Rd
- 130 Kootenai Dr
- 42965 Corte Verde
- 42955 Corte Verde
- 335 Via Rosario
- 44486 View Point Cir
- 473 Hunter Ln
- 44474 View Point Cir
- 565 View Point Ct
- 552 View Point Ct
- 385 Fawn Ct
- 449 Hunter Ln
- 44296 Hunter Place
- 44462 View Point Cir
- 44126 Linda Vista Rd
- 398 Fawn Ct
- 44495 View Point Cir
- 44483 View Point Cir
- 44414 View Point Cir
- 44390 View Point Cir
- 44210 View Point Cir
- 44293 Hunter Place
- 44438 View Point Cir
- 44222 View Point Cir
- 44274 Hunter Place