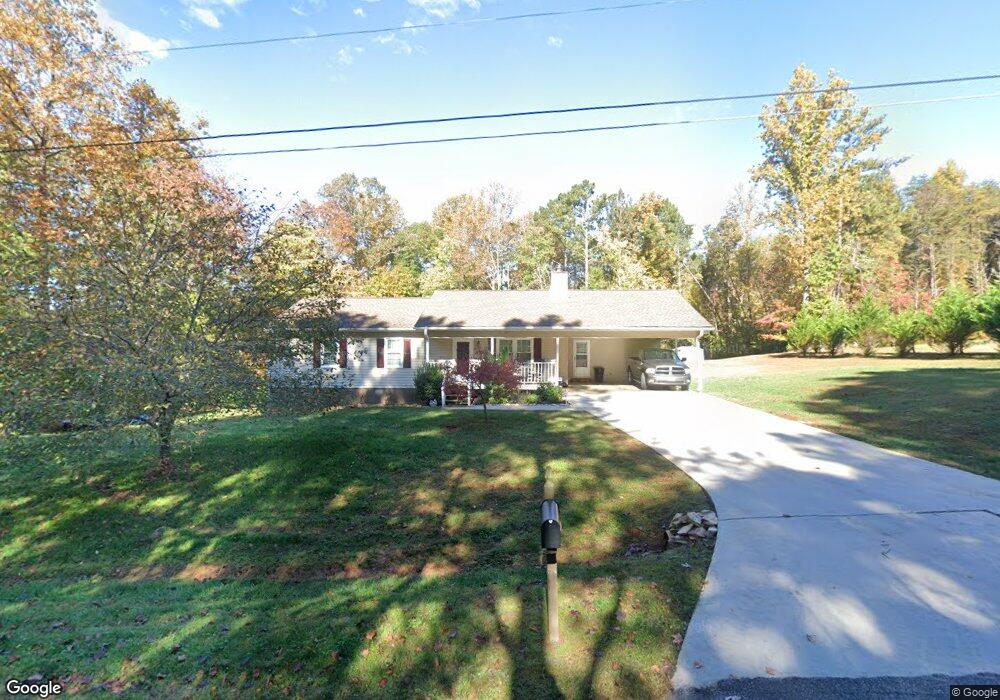
4970 Caney Creek Dr Gainesville, GA 30507
Southeast Gainesville NeighborhoodEstimated Value: $255,000 - $383,000
3
Beds
2
Baths
1,380
Sq Ft
$231/Sq Ft
Est. Value
About This Home
This home is located at 4970 Caney Creek Dr, Gainesville, GA 30507 and is currently estimated at $319,307, approximately $231 per square foot. 4970 Caney Creek Dr is a home located in Hall County with nearby schools including Chestnut Mountain Elementary School, Cherokee Bluff Middle School, and Cherokee Bluff High School.
Ownership History
Date
Name
Owned For
Owner Type
Purchase Details
Closed on
Jul 21, 2017
Sold by
Porter Rhonda T
Bought by
Patterson Rhonda Terri and Patterson Stephen Donald
Current Estimated Value
Home Financials for this Owner
Home Financials are based on the most recent Mortgage that was taken out on this home.
Original Mortgage
$125,000
Outstanding Balance
$64,602
Interest Rate
3.9%
Mortgage Type
New Conventional
Estimated Equity
$254,705
Purchase Details
Closed on
Dec 5, 2002
Sold by
Parks Raleigh Thomas
Bought by
Porter Rhonda T
Home Financials for this Owner
Home Financials are based on the most recent Mortgage that was taken out on this home.
Original Mortgage
$103,200
Interest Rate
5.75%
Mortgage Type
New Conventional
Purchase Details
Closed on
Apr 17, 2002
Sold by
Porter Alan Carlton
Bought by
Porter Rhonda Terri
Create a Home Valuation Report for This Property
The Home Valuation Report is an in-depth analysis detailing your home's value as well as a comparison with similar homes in the area
Home Values in the Area
Average Home Value in this Area
Purchase History
| Date | Buyer | Sale Price | Title Company |
|---|---|---|---|
| Patterson Rhonda Terri | -- | -- | |
| Porter Rhonda T | -- | -- | |
| Porter Rhonda Terri | -- | -- |
Source: Public Records
Mortgage History
| Date | Status | Borrower | Loan Amount |
|---|---|---|---|
| Open | Patterson Rhonda Terri | $125,000 | |
| Previous Owner | Porter Rhonda T | $103,200 |
Source: Public Records
Tax History Compared to Growth
Tax History
| Year | Tax Paid | Tax Assessment Tax Assessment Total Assessment is a certain percentage of the fair market value that is determined by local assessors to be the total taxable value of land and additions on the property. | Land | Improvement |
|---|---|---|---|---|
| 2025 | $1,609 | $124,400 | $27,360 | $97,040 |
| 2024 | $1,684 | $67,120 | $5,720 | $61,400 |
| 2023 | $1,210 | $63,800 | $5,720 | $58,080 |
| 2022 | $1,409 | $53,800 | $5,720 | $48,080 |
| 2021 | $1,420 | $53,280 | $5,720 | $47,560 |
| 2020 | $1,402 | $51,160 | $5,720 | $45,440 |
| 2019 | $1,332 | $48,160 | $5,720 | $42,440 |
| 2018 | $1,235 | $43,200 | $5,720 | $37,480 |
| 2017 | $1,089 | $38,418 | $5,120 | $33,298 |
| 2016 | $1,064 | $38,418 | $5,120 | $33,298 |
| 2015 | $1,072 | $38,418 | $5,120 | $33,298 |
| 2014 | $1,072 | $38,418 | $5,120 | $33,298 |
Source: Public Records
Map
Nearby Homes
- 4880 Sherman Allen Rd
- 3792 Tanners Mill Rd
- 5007 Chastain Way
- 5321 Shadow Walk Way
- 4745 Shady Lake Cir
- 1060 Regency Park Dr Unit 11
- 4156 Evian Way
- 3325 Tanners Mill Rd
- 4568 White Horse Dr
- 102 Cheval Ct
- 44 Palomino Cir
- 5322 Windridge Pkwy Unit 18A
- 5326 Windridge Pkwy Unit 19A
- 5326 Windridge Pkwy
- 4609 Hunters Ct
- 5339 Milford Dr Unit 205A
- 5339 Milford Dr
- 4030 Camp Springs Dr
- 4715 Creek Wood Dr
- 4121 Evian Way
- 4976 Caney Creek Dr
- 4964 Caney Creek Dr
- 4971 Caney Creek Dr
- 4977 Caney Creek Dr
- 4967 Caney Creek Dr
- 4961 Caney Creek Dr
- 4958 Caney Creek Dr
- 4955 Caney Creek Dr
- 4984 Caney Creek Dr
- 4946 Caney Creek Dr
- 5409 Woodstream Ct
- 5405 Woodstream Ct
- 5401 Woodstream Ct
- 4945 Caney Creek Dr
- 5402 Woodstream Ct
- 4856 Sherman Allen Rd
- 5417 Woodstream Ct
- 5423 Woodstream Ct
- 5406 Woodstream Ct
- 5410 Woodstream Ct