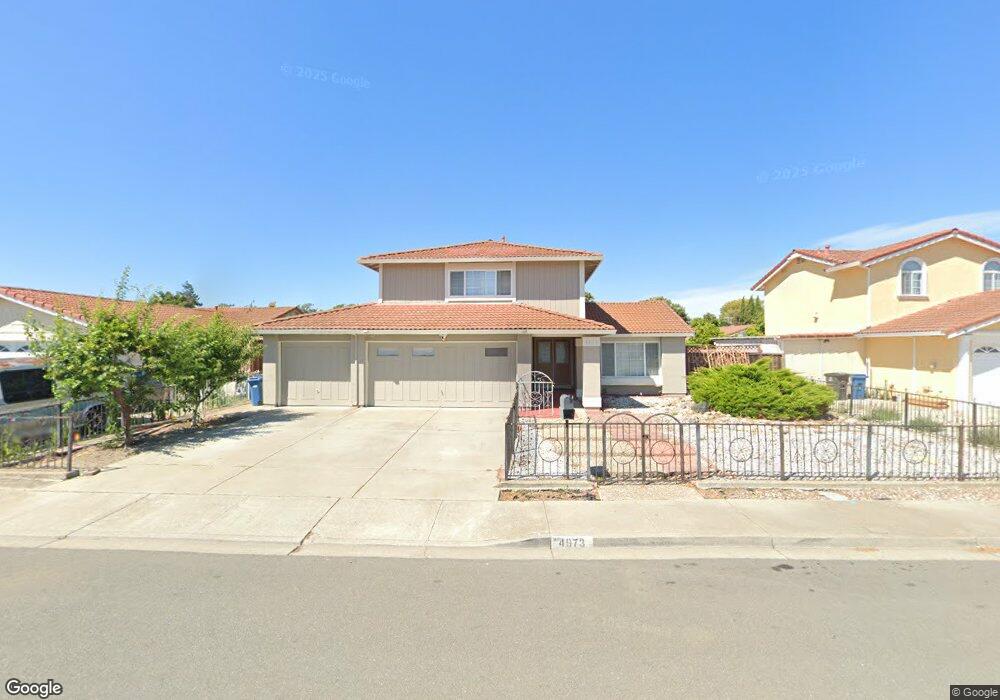
4973 Antioch Loop Union City, CA 94587
Alvarado NeighborhoodEstimated Value: $1,380,000 - $1,637,000
4
Beds
3
Baths
1,871
Sq Ft
$796/Sq Ft
Est. Value
About This Home
This home is located at 4973 Antioch Loop, Union City, CA 94587 and is currently estimated at $1,488,440, approximately $795 per square foot. 4973 Antioch Loop is a home located in Alameda County with nearby schools including Pioneer Elementary School, Itliong-Vera Cruz, and James Logan High School.
Ownership History
Date
Name
Owned For
Owner Type
Purchase Details
Closed on
Jan 20, 2018
Sold by
Singh Hardial and Kaur Amarjeet
Bought by
Singh Hardial and Kaur Amarjeet
Current Estimated Value
Home Financials for this Owner
Home Financials are based on the most recent Mortgage that was taken out on this home.
Original Mortgage
$398,000
Outstanding Balance
$335,521
Interest Rate
3.9%
Mortgage Type
New Conventional
Estimated Equity
$1,152,919
Purchase Details
Closed on
Jan 5, 2018
Sold by
Ferrer Procefina and The Medina Buan Lansang Living
Bought by
Singh Hardial and Kaur Amarjeet
Home Financials for this Owner
Home Financials are based on the most recent Mortgage that was taken out on this home.
Original Mortgage
$398,000
Outstanding Balance
$335,521
Interest Rate
3.9%
Mortgage Type
New Conventional
Estimated Equity
$1,152,919
Purchase Details
Closed on
Jun 7, 2010
Sold by
Lansang Medina B
Bought by
Lansang Medina Buan and Ferrer Procefina
Purchase Details
Closed on
Oct 20, 1993
Sold by
Lansang Bartolome D and Lansang Medina B
Bought by
Lansang Bartolome D and Lansang Medina B
Home Financials for this Owner
Home Financials are based on the most recent Mortgage that was taken out on this home.
Original Mortgage
$88,000
Interest Rate
6.81%
Create a Home Valuation Report for This Property
The Home Valuation Report is an in-depth analysis detailing your home's value as well as a comparison with similar homes in the area
Home Values in the Area
Average Home Value in this Area
Purchase History
| Date | Buyer | Sale Price | Title Company |
|---|---|---|---|
| Singh Hardial | -- | Wfg National Title Insurance | |
| Singh Hardial | $880,000 | Wfg National Title Insurance | |
| Lansang Medina Buan | -- | None Available | |
| Lansang Bartolome D | -- | North American Title Company |
Source: Public Records
Mortgage History
| Date | Status | Borrower | Loan Amount |
|---|---|---|---|
| Open | Singh Hardial | $398,000 | |
| Previous Owner | Lansang Bartolome D | $88,000 |
Source: Public Records
Tax History Compared to Growth
Tax History
| Year | Tax Paid | Tax Assessment Tax Assessment Total Assessment is a certain percentage of the fair market value that is determined by local assessors to be the total taxable value of land and additions on the property. | Land | Improvement |
|---|---|---|---|---|
| 2025 | $5,779 | $347,088 | $157,904 | $196,184 |
| 2024 | $5,779 | $340,147 | $154,809 | $192,338 |
| 2023 | $5,547 | $340,340 | $151,773 | $188,567 |
| 2022 | $5,443 | $326,668 | $148,798 | $184,870 |
| 2021 | $5,303 | $320,127 | $145,881 | $181,246 |
| 2020 | $5,311 | $323,773 | $144,385 | $179,388 |
| 2019 | $5,291 | $317,427 | $141,555 | $175,872 |
| 2018 | $4,144 | $230,862 | $53,304 | $177,558 |
| 2017 | $4,051 | $226,337 | $52,259 | $174,078 |
| 2016 | $3,951 | $221,900 | $51,235 | $170,665 |
| 2015 | $3,890 | $218,567 | $50,465 | $168,102 |
| 2014 | $3,731 | $214,286 | $49,477 | $164,809 |
Source: Public Records
Map
Nearby Homes
- 33064 Compton Ct
- 32945 Regents Blvd
- 4611 Carmen Way
- 4639 Michelle Ct
- 34102 Zaner Way
- 4532 Delores Dr
- 32409 Elizabeth Way
- 32451 Regents Blvd
- 4506 Birchwood Ct
- 32447 Pacific Grove Way
- 34192 Firenze Terrace
- 5621 Via Lugano
- 4231 Hanford St
- 34198 Tony Terrace
- 4272 Warbler Loop
- 5301 Shamrock Common
- 4243 Comet Cir
- 4201 Saturn Way
- 4214 Saturn Way
- 6004 Pisa Terrace Unit 119
- 4971 Antioch Loop
- 4975 Antioch Loop
- 4922 Antioch Loop
- 4920 Antioch Loop
- 4924 Antioch Loop
- 4969 Antioch Loop
- 4974 Antioch Loop
- 4976 Antioch Loop
- 4926 Antioch Loop
- 4972 Antioch Loop
- 4978 Antioch Loop
- 4967 Antioch Loop
- 4970 Antioch Loop
- 4928 Antioch Loop
- 4906 Rocklin Dr
- 4910 Rocklin Dr
- 4968 Antioch Loop
- 4902 Rocklin Dr
- 4965 Antioch Loop
- 4914 Rocklin Dr