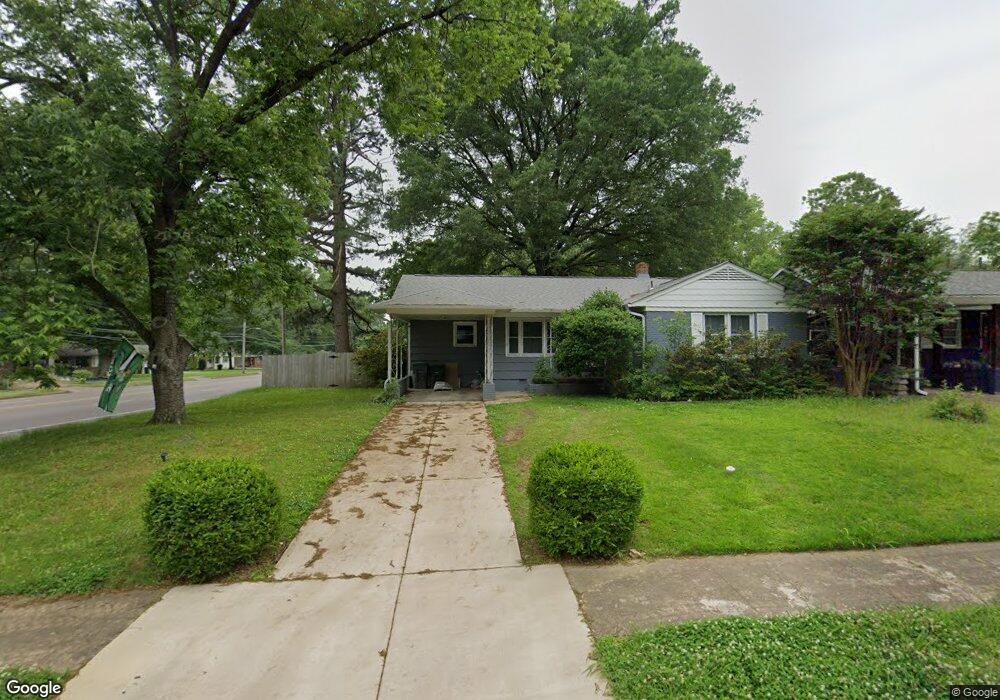
4975 Flamingo Rd Memphis, TN 38117
Colonial Acres NeighborhoodEstimated Value: $152,000 - $196,000
3
Beds
2
Baths
1,016
Sq Ft
$173/Sq Ft
Est. Value
About This Home
This home is located at 4975 Flamingo Rd, Memphis, TN 38117 and is currently estimated at $175,320, approximately $172 per square foot. 4975 Flamingo Rd is a home located in Shelby County with nearby schools including Sea Isle Elementary School, Colonial Middle, and Overton High.
Ownership History
Date
Name
Owned For
Owner Type
Purchase Details
Closed on
Oct 31, 2005
Sold by
Hulen Mark and Hulen Shannon Schatz
Bought by
Toepfert Jennifer M
Current Estimated Value
Home Financials for this Owner
Home Financials are based on the most recent Mortgage that was taken out on this home.
Original Mortgage
$87,200
Outstanding Balance
$48,390
Interest Rate
6.25%
Mortgage Type
Fannie Mae Freddie Mac
Estimated Equity
$126,930
Purchase Details
Closed on
Jun 15, 2001
Sold by
Wynne Fairfax R
Bought by
Hulen Mark and Schatz Shannon
Home Financials for this Owner
Home Financials are based on the most recent Mortgage that was taken out on this home.
Original Mortgage
$90,286
Interest Rate
7.06%
Mortgage Type
FHA
Purchase Details
Closed on
May 29, 1996
Sold by
Rounds Adrian A and Rounds Lisa O
Bought by
Wynne Fairfax R
Home Financials for this Owner
Home Financials are based on the most recent Mortgage that was taken out on this home.
Original Mortgage
$67,178
Interest Rate
7.88%
Mortgage Type
FHA
Create a Home Valuation Report for This Property
The Home Valuation Report is an in-depth analysis detailing your home's value as well as a comparison with similar homes in the area
Home Values in the Area
Average Home Value in this Area
Purchase History
| Date | Buyer | Sale Price | Title Company |
|---|---|---|---|
| Toepfert Jennifer M | $109,000 | -- | |
| Hulen Mark | $91,000 | Southern Escrow Title Compan | |
| Wynne Fairfax R | $66,500 | -- |
Source: Public Records
Mortgage History
| Date | Status | Borrower | Loan Amount |
|---|---|---|---|
| Open | Toepfert Jennifer M | $87,200 | |
| Previous Owner | Hulen Mark | $90,286 | |
| Previous Owner | Wynne Fairfax R | $67,178 | |
| Closed | Toepfert Jennifer M | $21,800 |
Source: Public Records
Tax History Compared to Growth
Tax History
| Year | Tax Paid | Tax Assessment Tax Assessment Total Assessment is a certain percentage of the fair market value that is determined by local assessors to be the total taxable value of land and additions on the property. | Land | Improvement |
|---|---|---|---|---|
| 2025 | $1,142 | $40,600 | $8,100 | $32,500 |
| 2024 | $1,142 | $33,700 | $5,625 | $28,075 |
| 2023 | $2,053 | $33,700 | $5,625 | $28,075 |
| 2022 | $2,053 | $33,700 | $5,625 | $28,075 |
| 2021 | $2,077 | $33,700 | $5,625 | $28,075 |
| 2020 | $1,589 | $21,925 | $5,625 | $16,300 |
| 2019 | $1,589 | $21,925 | $5,625 | $16,300 |
| 2018 | $1,589 | $21,925 | $5,625 | $16,300 |
| 2017 | $901 | $21,925 | $5,625 | $16,300 |
| 2016 | $1,024 | $23,425 | $0 | $0 |
| 2014 | $1,024 | $23,425 | $0 | $0 |
Source: Public Records
Map
Nearby Homes
- 4891 Flamingo Rd
- 4885 Flamingo Rd
- 1403 Whitewater Rd
- 4944 Mockingbird Ln
- 4908 Mockingbird Ln
- 1321 Wilbec Rd
- 5080 Sea Isle Rd
- 5055 Wingdale Rd
- 4861 Parkside Ave
- 5067 Wingdale Rd
- 1292 S White Station Rd
- 4803 Hummingbird Ln
- 4861 Verne Rd
- 4804 Hummingbird Ln
- 1232 S White Station Rd
- 1340 S White Station Rd
- 5076 Dee Rd
- 4888 Dee Rd
- 1485 Ivy Rd
- 4841 Dee Rd
- 4969 Flamingo Rd
- 4974 Amboy Rd
- 4968 Amboy Rd
- 4991 Flamingo Rd
- 4960 Amboy Rd
- 4957 Flamingo Rd
- 4976 Flamingo Rd
- 4964 Flamingo Rd
- 1312 Mount Moriah Rd
- 4954 Amboy Rd
- 4951 Flamingo Rd
- 1320 Mount Moriah Rd
- 4992 Flamingo Rd
- 4958 Flamingo Rd
- 5001 Flamingo Rd
- 1326 Mount Moriah Rd
- 4975 Amboy Rd
- 4946 Amboy Rd
- 4952 Flamingo Rd
- 4945 Flamingo Rd