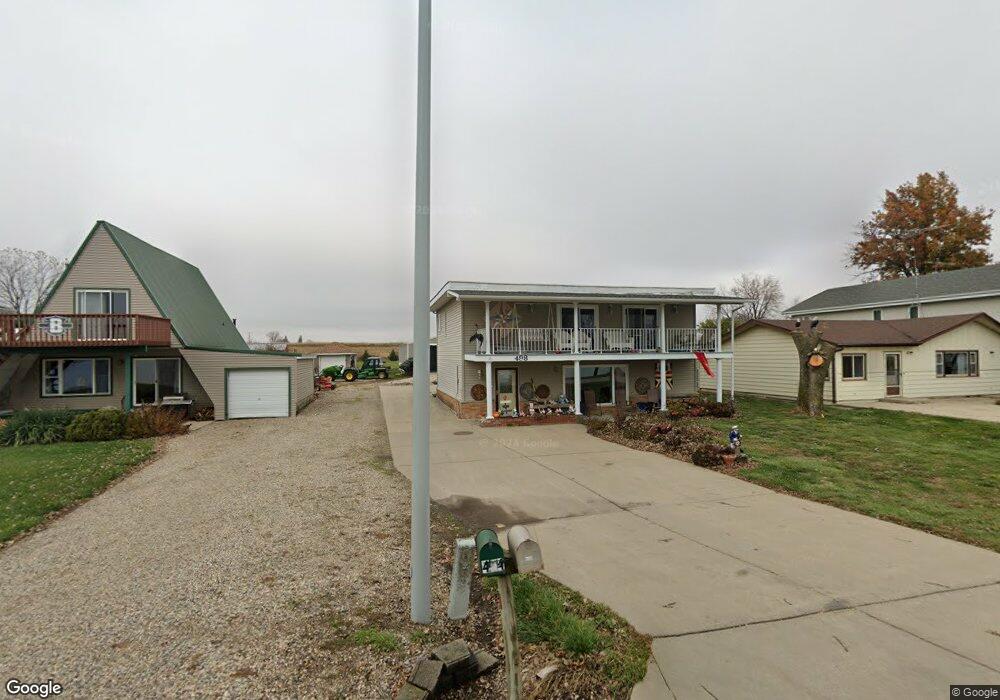
498 N State Rd Lake View, IA 51450
Estimated Value: $484,717 - $653,000
3
Beds
2
Baths
1,820
Sq Ft
$305/Sq Ft
Est. Value
About This Home
This home is located at 498 N State Rd, Lake View, IA 51450 and is currently estimated at $555,929, approximately $305 per square foot. 498 N State Rd is a home located in Sac County with nearby schools including East Sac County High School.
Ownership History
Date
Name
Owned For
Owner Type
Purchase Details
Closed on
Jul 7, 2016
Sold by
Robert F Howell
Bought by
Fevold Mark and Fevold Lynnette
Current Estimated Value
Home Financials for this Owner
Home Financials are based on the most recent Mortgage that was taken out on this home.
Original Mortgage
$290,000
Outstanding Balance
$230,230
Interest Rate
3.41%
Estimated Equity
$325,699
Purchase Details
Closed on
Jun 29, 2016
Sold by
Howell Robert F
Bought by
Fevold Mark and Fevold Lynnette
Home Financials for this Owner
Home Financials are based on the most recent Mortgage that was taken out on this home.
Original Mortgage
$290,000
Outstanding Balance
$230,230
Interest Rate
3.41%
Estimated Equity
$325,699
Create a Home Valuation Report for This Property
The Home Valuation Report is an in-depth analysis detailing your home's value as well as a comparison with similar homes in the area
Home Values in the Area
Average Home Value in this Area
Purchase History
| Date | Buyer | Sale Price | Title Company |
|---|---|---|---|
| Fevold Mark | -- | -- | |
| Fevold Mark | -- | None Available |
Source: Public Records
Mortgage History
| Date | Status | Borrower | Loan Amount |
|---|---|---|---|
| Open | Fevold Mark | $290,000 | |
| Closed | Fevold Mark | -- |
Source: Public Records
Tax History Compared to Growth
Tax History
| Year | Tax Paid | Tax Assessment Tax Assessment Total Assessment is a certain percentage of the fair market value that is determined by local assessors to be the total taxable value of land and additions on the property. | Land | Improvement |
|---|---|---|---|---|
| 2025 | $5,456 | $525,850 | $114,750 | $411,100 |
| 2024 | $5,456 | $425,750 | $95,630 | $330,120 |
| 2023 | $4,350 | $425,750 | $95,630 | $330,120 |
| 2022 | $4,166 | $302,950 | $76,500 | $226,450 |
| 2021 | $4,166 | $299,470 | $76,500 | $222,970 |
| 2020 | $3,792 | $267,380 | $61,200 | $206,180 |
| 2019 | $3,462 | $267,380 | $61,200 | $206,180 |
| 2018 | $3,590 | $239,900 | $0 | $0 |
| 2017 | $3,590 | $204,880 | $0 | $0 |
| 2016 | $142 | $204,880 | $0 | $0 |
| 2015 | $142 | $197,620 | $0 | $0 |
| 2014 | $254 | $197,620 | $0 | $0 |
Source: Public Records
Map
Nearby Homes
- 504 N State Rd
- 494 N State Rd
- 508 N State Rd
- 490 N State Rd
- 514 N State Rd
- 484 1/2 N State Rd
- 484 1/2 N State Rd
- 482 N State Rd
- 520 N State Rd
- 524 N State Rd
- 476 N State Rd
- 532 1/2 N State Rd
- 530 N State Rd
- 466 N State Rd
- 538 1/2 N State Rd
- 544 N State Rd
- 456 N State Rd
- 460 N State Rd
- 450 N State Rd
- 548 N State Rd